Stock Analysis · Viridian Therapeutics Inc (VRDN)
Overview
Viridian Therapeutics is a biotechnology company focused on thyroid eye disease, often shortened to TED. TED is a rare autoimmune condition that can cause eye bulging, pain, double vision, and vision damage. Viridian’s strategy is to build a portfolio of treatments aimed at improving efficacy, convenience, and patient experience versus older options. The company is not yet a broad commercial pharmaceutical business; it is still primarily a clinical-stage developer working to move lead drug candidates through late-stage testing and, if successful, toward regulatory approval and launch.
Its pipeline has centered on anti-IGF-1R therapies for TED, including intravenous and subcutaneous approaches. This matters because the current marketed standard in the disease has shown that the category can generate meaningful sales, but there is still room for products that are easier to administer, potentially require fewer infusions, or offer stronger durability. That is the commercial opening Viridian is targeting.
Revenue is still limited and does not yet reflect a fully launched product base. Based on recent annual reporting, the company’s revenue sources are concentrated as follows:
- Collaboration and license-related revenue: approximately 98% to 100% — mainly milestone, option, or partnership-related payments rather than recurring product sales.
- Other revenue: approximately 0% to 2% — small miscellaneous amounts, with no meaningful commercial diversification yet.
- Product revenue: 0% — the company does not currently have a major approved commercial product generating recurring sales.
This revenue mix is important for long-term analysis because Viridian today is being valued mostly on future drug potential rather than current operating profits. Expenses are dominated by research and development, which is typical for a late-stage biotech pushing lead programs toward pivotal milestones. Over the last several years, operating costs have risen sharply while revenue has remained small, showing a business that is still in investment mode rather than harvest mode.
The financial flow highlights a familiar biotech pattern: very small revenue, rapidly expanding research spending, and large operating losses. The more notable shift is not in profitability, which remains deeply negative, but in the company’s willingness to spend aggressively to advance its TED programs.
Key Figures
| Metric | Value | Sector ⓘ |
|---|---|---|
| Date | Oct 17, 2026 | |
| Context | ||
| Sector | Healthcare | |
| Industry | Biotechnology | |
| Market Cap ⓘ | $2.08B | |
| Beta ⓘ | 1.10 | |
Value (Cheapness) | ||
| P/E Ratio ⓘ | N/A | 24.79 |
| P/B Ratio ⓘ | 3.19 | 3.08 |
| FCF Yield ⓘ | -16.09% | 3.15% |
| Dividend Yield ⓘ | N/A | 1.94% |
| EBIT / EV ⓘ | -20.59% | 0.57% |
| PEG ⓘ | N/A | |
Growth (Business expansion) | ||
| Revenue Growth ⓘ | 278.70% | 7.45% |
| RPS Growth (5Y CAGR) ⓘ | 35.40% | 8.61% |
| EPS Growth (5Y CAGR) ⓘ | -17.61% | -17.81% |
| BVPS Growth (5Y CAGR) ⓘ | 17.15% | 3.72% |
| Margin Growth (5Y Trend) ⓘ | N/A | -0.62% |
| FCF Growth (5Y CAGR) ⓘ | N/A | 1.04% |
| DPS Growth (5Y CAGR) ⓘ | -20.20% | 6.77% |
Quality (Business durability) | ||
| ROIC (Latest) ⓘ | -49.16% | 3.24% |
| ROA (Latest) ⓘ | -46.22% | 3.01% |
| ROIC (5Y Median) ⓘ | -59.83% | 4.60% |
| ROA (5Y Median) ⓘ | -43.79% | 1.89% |
| Net Debt / EBIT (Latest) ⓘ | N/A | 1.34 |
| Net Debt / EBIT (5Y Median) ⓘ | N/A | 1.84 |
| Net Debt / EBITDA (Latest) ⓘ | N/A | 1.00 |
| Net Debt / Assets ⓘ | 7.10% | 5.45% |
| EBITDA / Interest ⓘ | N/A | 9.64 |
| Operating Margin (Latest) ⓘ | -517.44% | 9.27% |
| Operating Margin (5Y Median) ⓘ | -7301.81% | 7.38% |
| Debt to Equity (Latest) ⓘ | 36.68% | 28.58% |
| Profit Margin (Latest) ⓘ | N/A | 3.59% |
| Free Cash Flow (Latest) ⓘ | -$335.04M | |
Momentum (Price trend) | ||
| 3Y Return ⓘ | +64.65% | +42.80% |
| 12M Return (excl. last month) ⓘ | +21.21% | +18.50% |
| 6M Return ⓘ | +31.45% | +7.57% |
| Price vs. 200-Day MA ⓘ | -11.98% | +5.12% |
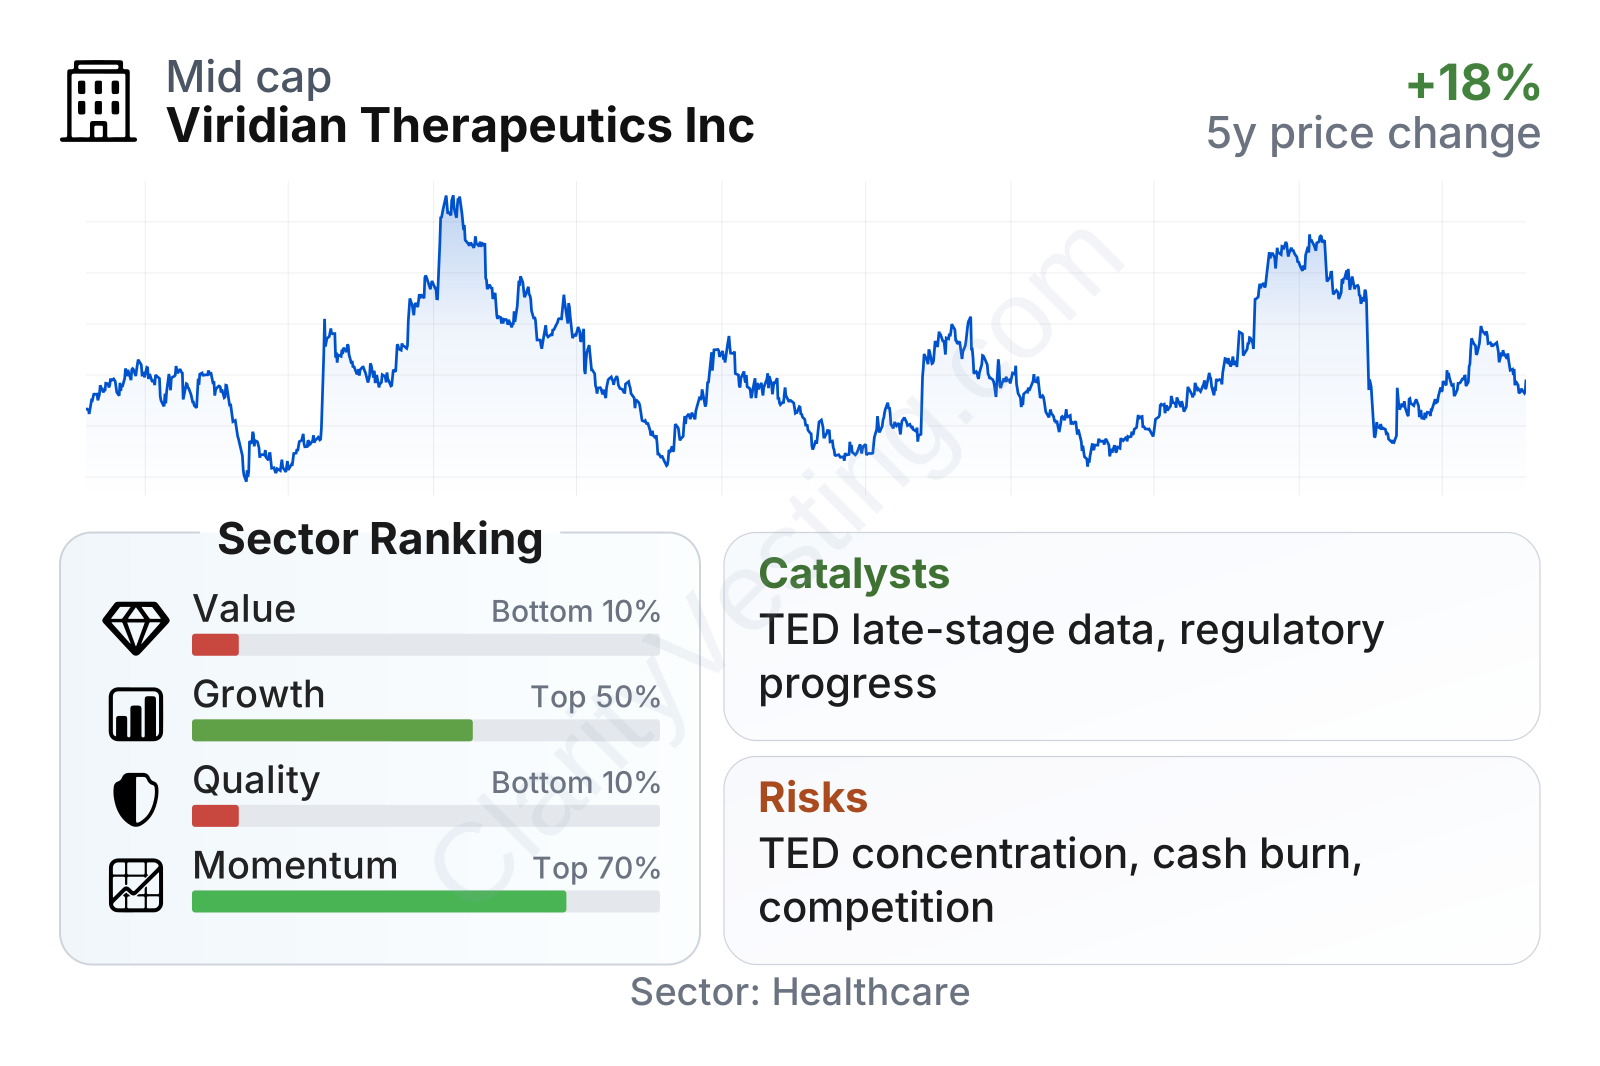
Viridian sits in the small-to-mid biotech range by market value, with share-price behavior that has been volatile over the last few years. That volatility is typical for development-stage drug companies, where valuation can move sharply on clinical updates, regulatory timing, and sentiment around a lead program. The metrics table points to a company that ranks weakly on value and quality measures today, but more favorably on growth indicators. In plain terms, the market is not looking at Viridian as a profitable operating business; it is looking at it as a pipeline-based company whose worth depends on future execution.
The contrast across categories is clear. Growth metrics look stronger than much of the healthcare sector, but profitability, returns on capital, and cash generation remain far below industry medians. That combination usually signals a business in transition: one with visible development momentum, but without the commercial proof needed to support conventional valuation measures.
Growth
Viridian operates in a part of biotech that remains attractive for long-term growth if its lead assets succeed. Thyroid eye disease is a specialized market, but it has already been commercially validated by an approved IGF-1R drug. That reduces one major uncertainty: the disease is real, the treatment need is recognized, and payers and physicians already understand the category. Viridian is therefore not trying to create a market from scratch; it is trying to improve on the current treatment profile.
The company’s strategy makes sense from a business perspective. In a rare disease setting, a better administration format can matter almost as much as efficacy. If a treatment can move from lengthy infusions toward a more convenient schedule or subcutaneous delivery while maintaining competitive results, that can materially improve adoption. Viridian has designed its development work around exactly that opportunity.
The revenue growth chart may look dramatic, but it should be read carefully. Large percentage swings are mostly the result of a very small starting base and irregular collaboration income, not a steady commercial ramp. So while headline growth appears strong, it does not yet represent the kind of recurring sales trajectory seen in mature drug companies.
The more meaningful growth signals are clinical and strategic rather than accounting-based. Recent company updates have focused on advancing late-stage development in TED, including programs intended to offer more convenient treatment options. For a business like Viridian, the biggest catalysts are usually pivotal trial data, regulatory interactions, and any signs that its product profile could compete effectively against the established incumbent. Positive progress on those fronts can significantly expand the company’s long-term revenue opportunity.
Free cash flow remains heavily negative and has worsened over time, which is consistent with a company funding expensive clinical development. That is not unusual in biotech, but it does mean the growth case depends on achieving major milestones before cash needs force additional financing on less favorable terms.
Risks
This article is for informational purposes only and does not constitute financial advice. Some content is AI-generated. See Disclaimer


