Stock Analysis · Valmont Industries Inc (VMI)
Overview
Valmont Industries is an industrial manufacturer focused on essential infrastructure. Its products are used to move electricity, support wireless communication networks, improve road safety and lighting, and help farms use water more efficiently. In simple terms, the company sells the physical equipment behind utility grids, telecom networks, transportation systems, and irrigation.
The business is mainly organized around two operating segments: Infrastructure and Agriculture. Infrastructure is the larger division and includes utility support structures, steel and concrete poles, transmission, substation and distribution components, lighting and traffic structures, and telecom structures. Agriculture is centered on mechanized irrigation systems, related technology, and aftermarket parts and services, mainly through the Valley brand.
Based on the latest annual reporting, revenue is led by the Infrastructure segment, with Agriculture as the second-largest source. Approximate revenue mix is as follows:
- Infrastructure: about 80% to 82% of revenue. This includes utility structures for electric transmission and distribution, telecom towers and related structures, lighting and traffic products, coatings, and engineered support systems.
- Agriculture: about 18% to 20% of revenue. This includes center pivot and linear irrigation equipment, controls, monitoring tools, and replacement parts.
Geographically, Valmont has a meaningful international footprint, but North America remains the company’s core market. That matters because many of its end markets are linked to long-cycle capital spending plans rather than short-lived consumer demand.
The profit profile has improved noticeably over the last few years. Revenue has been fairly stable around the low-$4 billion range recently, but margins expanded as the company reduced costs, improved pricing, and shifted toward more profitable work. That helps explain why earnings have risen faster than sales.
The overall pattern shows a business that did not need rapid revenue expansion to lift earnings. Gross profit stayed resilient while operating costs became more controlled after a weaker 2023, leading to a sharp rebound in operating income and net income in 2024 and solid profitability continuing into 2025.
Key Figures
| Metric | Value | Sector ⓘ |
|---|---|---|
| Date | Oct 03, 2026 | |
| Context | ||
| Sector | Industrials | |
| Industry | Conglomerates | |
| Market Cap ⓘ | $9.02B | |
| Beta ⓘ | 1.34 | |
Value (Cheapness) | ||
| P/E Ratio ⓘ | 18.28 | 22.45 |
| P/B Ratio ⓘ | 5.26 | 1.98 |
| FCF Yield ⓘ | 3.57% | 6.31% |
| Dividend Yield ⓘ | 0.62% | 1.96% |
| EBIT / EV ⓘ | 5.98% | 4.81% |
| PEG ⓘ | 0.96 | |
Growth (Business expansion) | ||
| Revenue Growth ⓘ | 6.50% | 9.10% |
| RPS Growth (5Y CAGR) ⓘ | 6.02% | 7.75% |
| EPS Growth (5Y CAGR) ⓘ | -4.47% | -13.59% |
| BVPS Growth (5Y CAGR) ⓘ | 6.50% | 6.22% |
| Margin Growth (5Y Trend) ⓘ | 1.54% | 0.72% |
| FCF Growth (5Y CAGR) ⓘ | N/A | 10.98% |
| DPS Growth (5Y CAGR) ⓘ | 8.11% | 9.48% |
Quality (Business durability) | ||
| ROIC (Latest) ⓘ | 22.14% | 10.92% |
| ROA (Latest) ⓘ | 14.49% | 5.41% |
| ROIC (5Y Median) ⓘ | 16.65% | 9.21% |
| ROA (5Y Median) ⓘ | 7.16% | 4.94% |
| Net Debt / EBIT (Latest) ⓘ | 1.25 | 2.07 |
| Net Debt / EBIT (5Y Median) ⓘ | 2.06 | 2.28 |
| Net Debt / EBITDA (Latest) ⓘ | 1.08 | 1.43 |
| Net Debt / Assets ⓘ | 21.14% | 19.27% |
| EBITDA / Interest ⓘ | 17.45 | 9.53 |
| Operating Margin (Latest) ⓘ | 13.88% | 10.50% |
| Operating Margin (5Y Median) ⓘ | 9.47% | 10.27% |
| Debt to Equity (Latest) ⓘ | 50.48% | 65.48% |
| Profit Margin (Latest) ⓘ | 11.70% | 6.62% |
| Free Cash Flow (Latest) ⓘ | $322.10M | |
Momentum (Price trend) | ||
| 3Y Return ⓘ | +97.46% | +58.56% |
| 12M Return (excl. last month) ⓘ | +28.80% | +15.63% |
| 6M Return ⓘ | +16.21% | +4.19% |
| Price vs. 200-Day MA ⓘ | -1.97% | +0.93% |
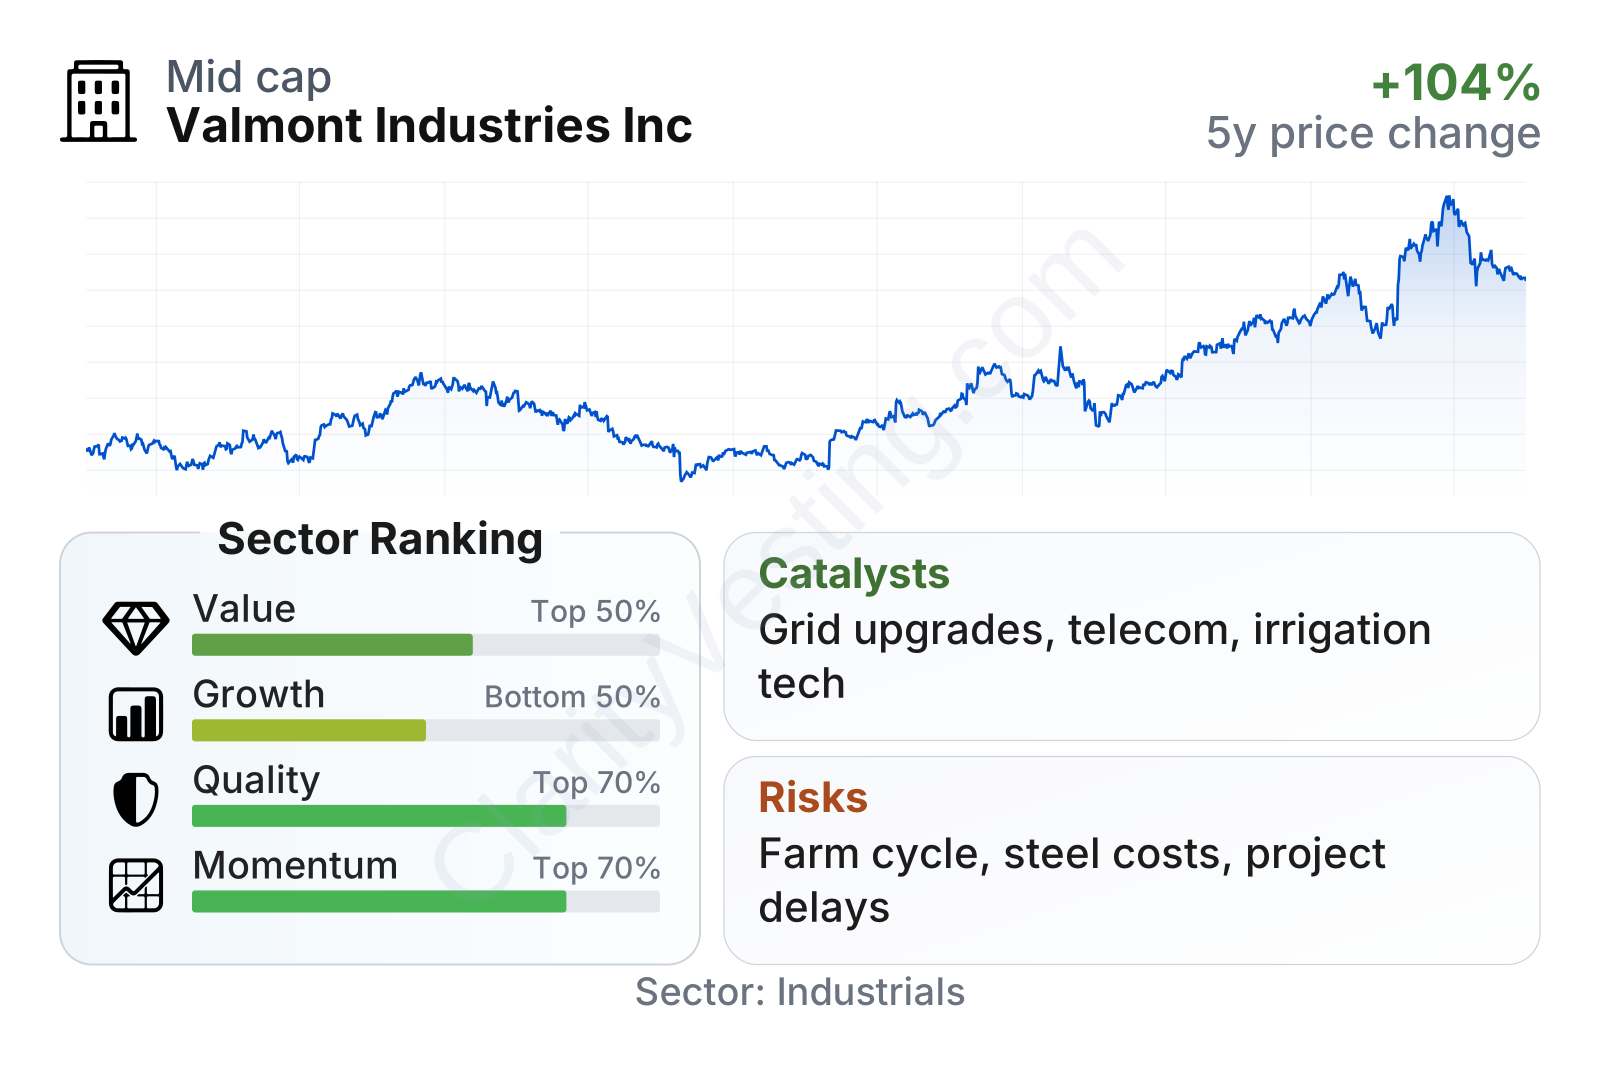
Valmont is a mid-to-large industrial company with a market value around $9 billion and a stock that tends to move more than the broader market, reflected in a beta above 1. On valuation, its earnings multiple sits below the sector median, but the picture is mixed because the price-to-book ratio is much higher than the sector norm and the free cash flow yield is lower. In other words, the market is giving credit to the company’s profitability and business quality rather than treating it as a cheap asset play.
The quality profile is clearly stronger than the growth profile. Returns on capital and assets are well above sector medians, operating margin is stronger than peers, and leverage looks controlled. Growth metrics are more moderate, with revenue expansion below the sector median, although earnings efficiency has improved materially. Price momentum has also been strong over multi-year and recent periods, even after the stock moved close to its long-term average in the most recent reading.
Growth
Valmont operates in markets with credible long-term support. Electric grid modernization, transmission buildout, renewable energy interconnections, telecom network upgrades, and infrastructure replacement all support demand for utility and communication structures. In agriculture, water scarcity and the need for better productivity continue to support mechanized irrigation over time, even if farm spending can be cyclical from year to year.
The company’s strategy is coherent for this environment. It is focused on businesses tied to mission-critical infrastructure, where reliability, engineering capability, and long customer relationships matter. That positioning is especially relevant in utility projects, where customers often prefer experienced suppliers that can deliver at scale and meet technical specifications. Valmont has also spent recent years improving operational discipline rather than simply chasing volume, which helps explain the stronger margin profile.
Recent sales growth has been positive again after a weaker patch in 2023 and much of 2024. The rebound is not explosive, but it suggests that demand has stabilized while profitability remains better than it was before. That combination can be attractive in an industrial business because even moderate sales gains can produce outsized earnings growth when margins are already improving.
Cash generation has also improved meaningfully compared with the more volatile period in 2022. Free cash flow remains positive and healthy, even though it has pulled back from a peak reading. For a company serving project-driven end markets, this matters: it gives management flexibility for capital spending, dividends, acquisitions, and debt reduction without relying heavily on outside financing.
One of the strongest catalysts is grid investment. Utilities in the United States and other regions continue to spend on transmission, substation, and distribution upgrades as electricity demand rises and networks become more complex. Data centers, industrial electrification, and renewable integration all increase the need for transmission-related infrastructure. Valmont is directly exposed to that spending through poles, structures, and related engineered products.
A second catalyst is the continued expansion of communication infrastructure. Wireless densification, broadband investment, and network resilience projects support demand for telecom structures and related products, though this market can be uneven from quarter to quarter.
In agriculture, the opportunity is less about a straight-line growth boom and more about structural efficiency needs. Water management, labor constraints, and precision agriculture tools support adoption of modern irrigation systems and digital controls. That does not remove cyclicality, but it does provide a long-run reason for the segment to remain relevant.
Risks
This article is for informational purposes only and does not constitute financial advice. Some content is AI-generated. See Disclaimer


