Stock Analysis · Valley National Bancorp (VLY)
Overview
Valley National Bancorp is a regional bank based in the United States. Through Valley National Bank, it provides traditional banking services such as commercial and consumer lending, deposit accounts, treasury and payment services, and wealth-related offerings. Its footprint is concentrated in attractive banking markets including New Jersey, New York, Florida, Alabama, California, and Illinois, with a business mix that leans heavily toward commercial customers rather than mass-market consumer banking.
Like most banks, Valley does not make money by selling physical products. Its core business is collecting deposits and turning those funds into loans and other earning assets. The largest part of revenue typically comes from net interest income, which is the spread between what the bank earns on loans and securities and what it pays on deposits and borrowings. A smaller but still useful stream comes from fees tied to customer services and wealth-related activities.
Based on the company’s recent annual disclosures, the revenue mix can be summarized approximately as follows:
- Net interest income: about 80% to 90% of total revenue. This includes income from commercial real estate loans, commercial and industrial loans, residential mortgages, consumer loans, and securities, minus interest paid on deposits and other funding.
- Non-interest income: about 10% to 20% of total revenue. This includes service charges on deposits, loan-related fees, wealth management and trust income, capital markets activities, and other banking service fees.
The business mix also matters inside the loan book. Valley has had a meaningful concentration in commercial real estate and multifamily lending, alongside commercial and industrial lending and residential real estate exposure. That gives it access to higher-value business relationships, but it also makes the company more sensitive to credit conditions and property-market trends than a bank built mainly around plain-vanilla consumer checking accounts.
Over the last few years, revenue expanded materially, but profitability became more uneven as funding costs rose sharply when interest rates moved higher. The broad pattern has been strong top-line expansion combined with pressure on margins, followed by some recovery.
The longer-term picture shows revenue growth from roughly $1.5 billion in 2021 to around $3.5 billion in 2025, but that growth did not flow smoothly to the bottom line. Interest expense climbed much faster during the rate shock, which squeezed operating income and net income before conditions improved again.
Key Figures
| Metric | Value | Sector ⓘ |
|---|---|---|
| Date | Oct 24, 2026 | |
| Context | ||
| Sector | Financial Services | |
| Industry | Banks - Regional | |
| Market Cap ⓘ | $7.19B | |
| Beta ⓘ | 1.09 | |
Value (Cheapness) | ||
| P/E Ratio ⓘ | 10.94 | 12.46 |
| P/B Ratio ⓘ | 0.97 | 1.25 |
| FCF Yield ⓘ | 7.72% | 9.82% |
| Dividend Yield ⓘ | 3.41% | 2.94% |
| EBIT / EV ⓘ | 4.31% | 8.11% |
| PEG ⓘ | 1.16 | |
Growth (Business expansion) | ||
| Revenue Growth ⓘ | 15.00% | 9.10% |
| RPS Growth (5Y CAGR) ⓘ | 14.27% | 12.31% |
| EPS Growth (5Y CAGR) ⓘ | -8.29% | -6.97% |
| BVPS Growth (5Y CAGR) ⓘ | 3.89% | 5.02% |
| Margin Growth (5Y Trend) ⓘ | -21.72% | -4.00% |
| FCF Growth (5Y CAGR) ⓘ | N/A | 4.71% |
| DPS Growth (5Y CAGR) ⓘ | 1.24% | 8.92% |
Quality (Business durability) | ||
| ROIC (Latest) ⓘ | 3.48% | 9.18% |
| ROE (Latest) ⓘ | 8.88% | 13.93% |
| ROA (Latest) ⓘ | 1.07% | 1.57% |
| ROIC (5Y Median) ⓘ | 5.77% | 7.80% |
| ROE (5Y Median) ⓘ | 7.85% | 12.15% |
| ROA (5Y Median) ⓘ | 0.94% | 1.28% |
| Net Debt / EBIT (Latest) ⓘ | 5.76 | 1.02 |
| Net Debt / EBIT (5Y Median) ⓘ | 4.11 | 0.72 |
| Net Debt / EBITDA (Latest) ⓘ | 5.01 | 0.88 |
| Operating Margin (Latest) ⓘ | 14.48% | 22.30% |
| Operating Margin (5Y Median) ⓘ | 21.30% | 24.50% |
| Debt to Equity (Latest) ⓘ | 43.63% | 59.34% |
| Profit Margin (Latest) ⓘ | 34.54% | 26.42% |
| Free Cash Flow (Latest) ⓘ | $555.18M | |
Momentum (Price trend) | ||
| 3Y Return ⓘ | +101.69% | +95.73% |
| 12M Return (excl. last month) ⓘ | +26.52% | +17.30% |
| 6M Return ⓘ | +5.86% | +6.07% |
| Price vs. 200-Day MA ⓘ | +4.48% | +5.36% |
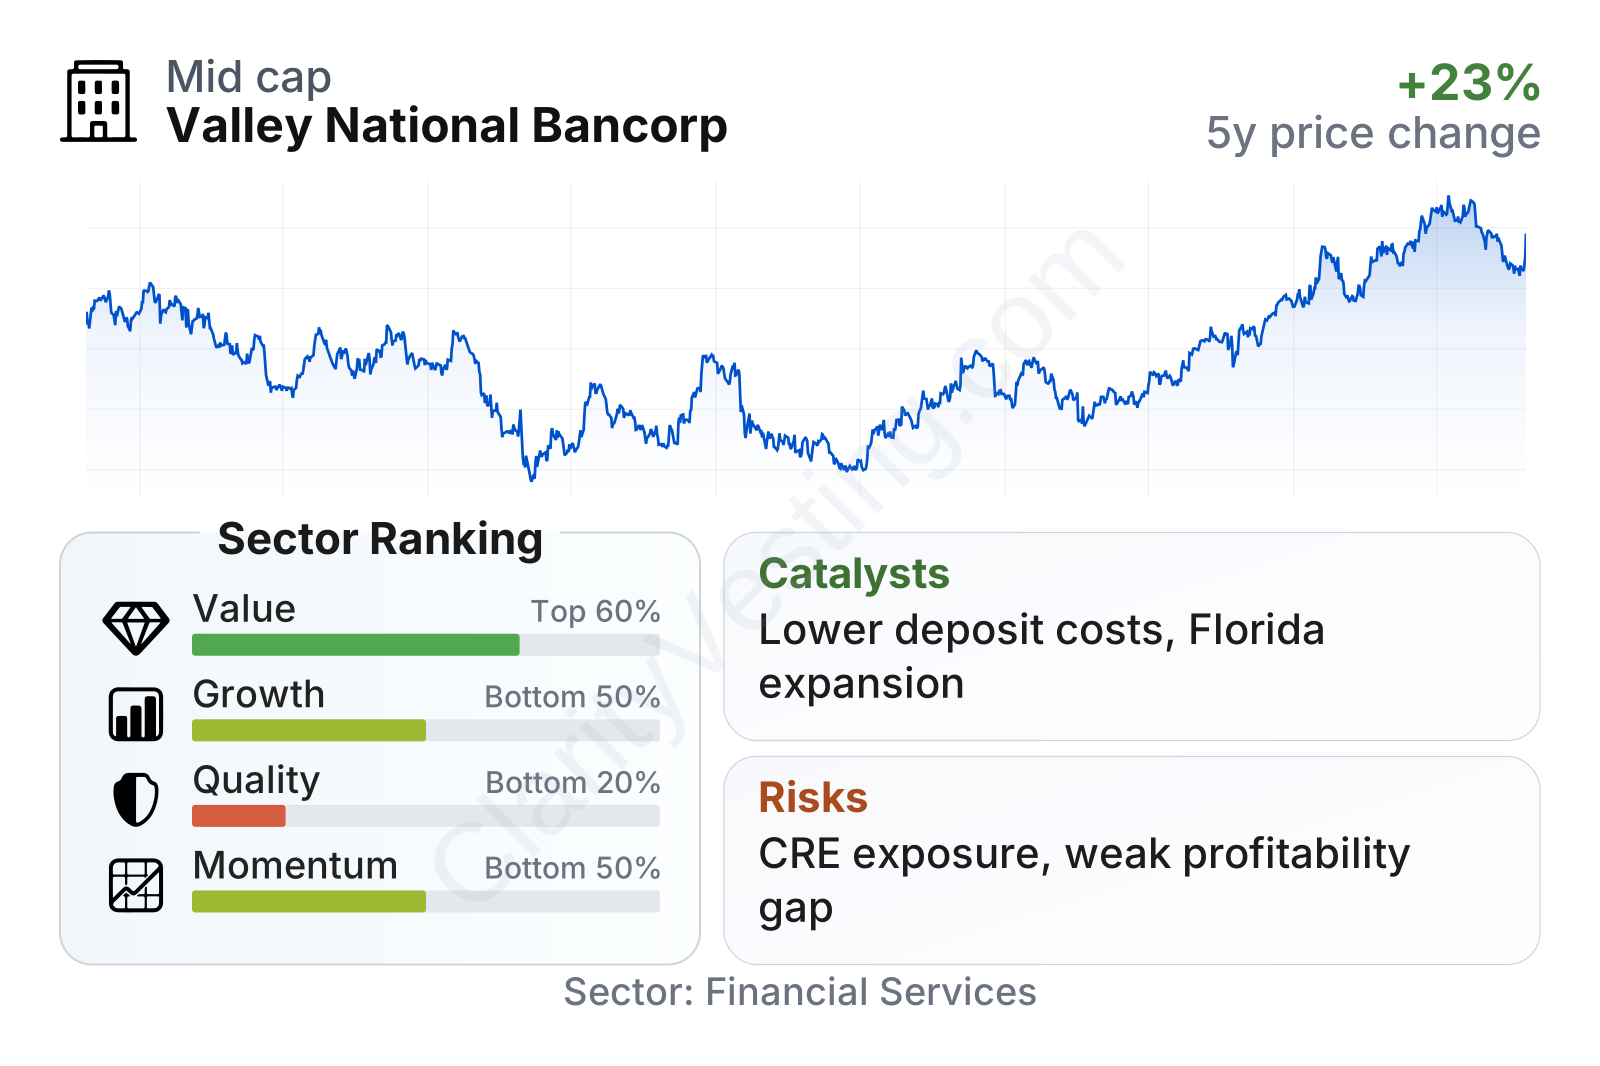
Valley sits in the mid-cap range among regional banks. On valuation, it screens somewhat cheaper than the sector on both earnings and book value, while offering a dividend yield modestly above the sector median. The weak spot is not growth in revenue, which has been decent, but the quality profile: returns on equity and assets remain below many peers, and margin performance over the last several years has been less consistent. Share-price performance has improved over the last year, although the longer record still reflects the stress that hit regional banks during the 2023 period and the slower recovery that followed.
Growth
Regional banking is not a high-growth industry in the way software or semiconductors can be, but it can still produce durable long-term expansion when a bank gains share in attractive local markets, deepens business relationships, and manages credit well. Valley’s footprint gives it exposure to faster-growing states such as Florida and to dense commercial markets around New York and New Jersey. That is a meaningful advantage because deposit gathering and loan demand tend to be better in markets with population growth, business formation, and healthy real estate activity.
Its strategy is logical for a bank of this size. Valley has focused on commercial banking relationships, specialized lending, and geographic expansion through both organic growth and acquisitions. The appeal of that model is that commercial clients often use multiple services at once: operating accounts, loans, treasury management, and sometimes wealth solutions. That can make relationships more valuable than a simple loan-only model.
Earnings have not followed a straight upward line. After stronger results in 2021 and 2022, earnings per share dropped sharply in 2024 before recovering in 2025. That pattern suggests the bank can generate good profitability in a normal rate environment, but it also shows that earnings are sensitive to funding costs and credit conditions. For long-term analysis, the important point is not just whether earnings bounced back, but whether the recovery proves durable over several years.
Book value per share, a useful measure for banks because it reflects the net value of their balance sheet over time, generally moved higher from 2021 through 2024 before a small pullback in 2025. That is still a constructive signal overall. It suggests Valley has been able to build capital and retained value over time even while going through a difficult period for the regional banking industry.
A visible catalyst for future growth is the normalization of deposit costs. When rates rose rapidly, many regional banks had to pay up to keep deposits, which hurt profitability. If funding pressure continues to ease while loan yields remain relatively healthy, Valley’s net interest margin can improve. Another catalyst is continued growth in fee businesses, which are less dependent on rate spreads and can make earnings more balanced.
Recent company updates have also pointed to continued balance-sheet repositioning and a focus on efficiency, capital strength, and relationship-based banking. For a regional bank, these are meaningful levers: better funding mix, disciplined loan growth, and steadier fee income can lift profitability without requiring dramatic expansion.
Risks
This article is for informational purposes only and does not constitute financial advice. Some content is AI-generated. See Disclaimer


