Stock Analysis · Volex plc (VLXGF)
Overview
Volex plc is a manufacturer of electrical power products and data connectivity solutions. In simple terms, it makes the cables, harnesses, connectors, plugs, and integrated assemblies that allow equipment to receive power, move data, and operate reliably. Its products are used in markets such as electric vehicles, consumer electricals, medical equipment, data centers, industrial technology, and complex electronics.
The business model is based on supplying both individual components and more complete assemblies for original equipment manufacturers. That matters because customers often prefer suppliers that can handle design support, tooling, manufacturing, and quality control across multiple geographies. Volex has built a global manufacturing footprint, with operations across Asia, Europe, and North America, which helps it serve multinational customers and support programs that need scale.
Based on the latest annual reporting, revenue is spread across a mix of end markets rather than a single product line. The largest sources are generally described by end market, with electric vehicles becoming increasingly important after recent acquisitions and program wins. The revenue mix can be summarized as follows:
- Consumer electricals: approximately 30% to 35% of revenue. This includes power cords, plugs, and related products used in household and commercial electrical applications.
- Electric vehicles: approximately 20% to 25%. This covers high-voltage and low-voltage connectivity, charging-related components, and assemblies used in vehicle platforms.
- Medical: approximately 15% to 20%. This segment includes cables and assemblies used in medical devices where reliability and regulatory standards are important.
- Industrial technology: approximately 10% to 15%. This includes power and data products for industrial equipment and automation applications.
- Consumer electronics: approximately 10% to 15%. These are connectivity and power products for electronics manufacturers.
- Data center and other complex applications: approximately 5% to 10%. This includes higher-specification power and connectivity solutions for infrastructure and specialized equipment.
Over the last several years, the company has also become more of a platform business through acquisitions, broadening its product range and increasing its exposure to faster-growing niches such as electric vehicles and data infrastructure. Financially, the broad direction has been positive: revenue has roughly doubled from about $591 million in fiscal 2022 to about $1.23 billion in fiscal 2026, while operating profit and net income have also moved higher.
The overall picture is one of expanding scale and improving gross profit, although manufacturing remains a margin-sensitive business. Cost of sales still absorbs most of revenue, so execution, sourcing, and plant efficiency remain central to the investment case.
Key Figures
| Metric | Value | Sector ⓘ |
|---|---|---|
| Date | Oct 17, 2026 | |
| Context | ||
| Sector | Industrials | |
| Industry | Electrical Equipment & Parts | |
| Market Cap ⓘ | $1.63B | |
| Beta ⓘ | 1.21 | |
Value (Cheapness) | ||
| P/E Ratio ⓘ | 25.71 | 22.10 |
| P/B Ratio ⓘ | 3.96 | 1.97 |
| FCF Yield ⓘ | 4.54% | 6.38% |
| Dividend Yield ⓘ | 0.69% | 1.94% |
| EBIT / EV ⓘ | 11.14% | 4.79% |
| PEG ⓘ | N/A | |
Growth (Business expansion) | ||
| Revenue Growth ⓘ | 15.90% | 9.30% |
| RPS Growth (5Y CAGR) ⓘ | 16.56% | 7.81% |
| EPS Growth (5Y CAGR) ⓘ | 20.57% | -13.06% |
| BVPS Growth (5Y CAGR) ⓘ | 17.72% | 6.14% |
| Margin Growth (5Y Trend) ⓘ | 2.34% | 0.88% |
| FCF Growth (5Y CAGR) ⓘ | 82.32% | 11.01% |
| DPS Growth (5Y CAGR) ⓘ | 0.90% | 9.48% |
Quality (Business durability) | ||
| ROIC (Latest) ⓘ | 25.19% | 10.84% |
| ROA (Latest) ⓘ | 11.62% | 5.41% |
| ROIC (5Y Median) ⓘ | 13.49% | 9.38% |
| ROA (5Y Median) ⓘ | 6.63% | 4.95% |
| Net Debt / EBIT (Latest) ⓘ | 0.80 | 2.08 |
| Net Debt / EBIT (5Y Median) ⓘ | 2.04 | 2.27 |
| Net Debt / EBITDA (Latest) ⓘ | 0.55 | 1.39 |
| Net Debt / Assets ⓘ | 14.67% | 19.28% |
| EBITDA / Interest ⓘ | 6.05 | 9.58 |
| Operating Margin (Latest) ⓘ | 8.19% | 10.50% |
| Operating Margin (5Y Median) ⓘ | 7.49% | 10.29% |
| Debt to Equity (Latest) ⓘ | 46.75% | 65.48% |
| Profit Margin (Latest) ⓘ | 5.30% | 6.67% |
| Free Cash Flow (Latest) ⓘ | $74.16M | |
Momentum (Price trend) | ||
| 3Y Return ⓘ | +157.42% | +61.68% |
| 12M Return (excl. last month) ⓘ | +82.11% | +12.58% |
| 6M Return ⓘ | +20.70% | 0.00% |
| Price vs. 200-Day MA ⓘ | +23.59% | +0.02% |
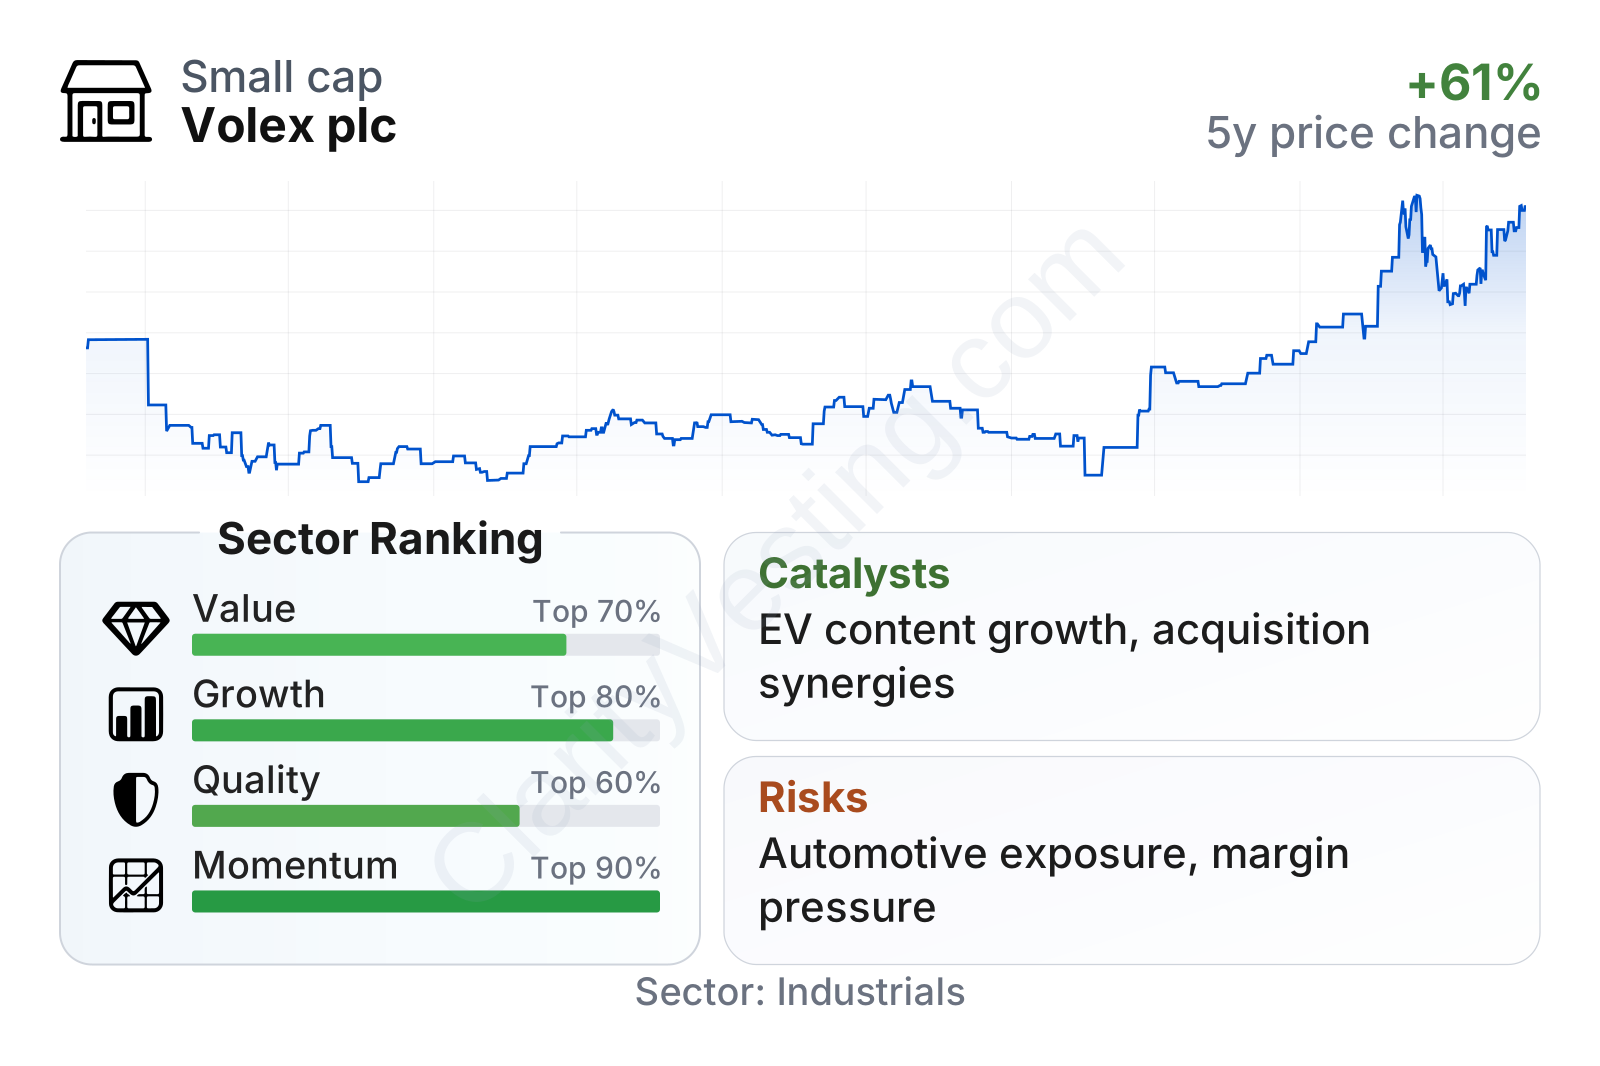
Volex sits in the upper part of its sector on growth and momentum, with revenue growth, earnings growth, and multi-year share performance clearly ahead of the median industrial peer. Profitability quality is more mixed: returns on capital and assets are strong, and leverage looks controlled, but operating and net margins remain below sector medians. That combination suggests a business that is executing well and using capital efficiently, yet still operates in a competitive manufacturing environment where margins are not especially wide.
The balance sheet appears manageable rather than stretched. Net debt relative to earnings is below the sector median, which gives the company some flexibility for operations and selective expansion. Free cash flow is positive, though the cash flow yield and dividend yield are not standout features at the current valuation. In short, the company’s profile looks more like a growth-oriented industrial supplier than an income or deep-value name.
Growth
Volex is exposed to several end markets with favorable long-term demand trends. The most important is electrification, especially in vehicles, where wiring content and connector complexity tend to rise as cars become more electric and more software-driven. Data infrastructure is another supportive area, as higher power density and faster data transmission create demand for reliable interconnect solutions. Medical devices also provide a steadier source of demand because quality requirements and validation cycles can make supplier relationships more durable.
The company’s strategy broadly makes sense for future growth. It combines organic expansion with acquisitions, then uses its larger manufacturing and sourcing base to cross-sell products and improve efficiency. This can work well in a fragmented industry where customers often want fewer suppliers capable of serving multiple regions and product families. The rapid increase in revenue and gross profit over the last five years suggests the strategy has delivered scale, not just temporary sales growth.
A notable recent catalyst is the company’s rising exposure to electric vehicles. Management has highlighted EV programs and broader diversification into higher-value applications as a driver of medium-term expansion. This matters because EV-related products tend to be more technically demanding than standard commodity cable products, which can support stronger customer retention and better economics if execution remains solid.
Another encouraging feature is the improvement in operating performance alongside growth. Operating income has advanced materially since fiscal 2022, and the latest margin trend over five years is better than the sector median. Even though margins are still not high in absolute terms, the direction has been favorable, which is often more important for a company that is still integrating acquisitions and moving into more specialized product categories.
Risks
This article is for informational purposes only and does not constitute financial advice. Some content is AI-generated. See Disclaimer


