Stock Analysis · Veralto Corporation (VLTO)
Overview
Veralto Corporation is an industrial technology company focused on two practical needs that tend to remain important in almost any economic environment: water quality and product quality. The company was separated from Danaher in 2023 and now operates as a standalone business serving municipal utilities, industrial customers, laboratories, food and beverage producers, pharmaceuticals, packaging, and other manufacturers. Its products and services help customers analyze, treat, monitor, and manage water, while also helping manufacturers inspect, mark, trace, and verify products across production lines and supply chains.
Veralto reports through two main segments. Based on recent annual reporting, revenue is split roughly as follows:
- Water Quality - about 57%: instruments, software, consumables, and services used in water analytics, water treatment, and related monitoring applications. This includes testing and measurement equipment, ultraviolet disinfection, and filtration-related solutions.
- Product Quality & Innovation - about 43%: coding, marking, packaging, inspection, and color-management tools used by manufacturers to improve traceability, compliance, appearance, and production efficiency.
This mix matters for long-term analysis because a meaningful share of Veralto’s business comes from recurring sources such as consumables, services, software, and aftermarket support rather than only large one-time equipment sales. The company’s customer base is also broad, which reduces reliance on any single end market. Over the last several years, revenue has moved upward from about $4.7 billion in 2021 to roughly $5.5 billion in 2025, while gross profit has risen faster than cost of revenue, pointing to a business with pricing discipline and favorable economics.
The financial flow shows a business that has gradually expanded revenue and operating profit while keeping production costs relatively controlled. Selling and administrative expenses have also risen, but profitability has remained strong enough to support a high level of cash generation.
Key Figures
| Metric | Value | Sector ⓘ |
|---|---|---|
| Date | Oct 24, 2026 | |
| Context | ||
| Sector | Industrials | |
| Industry | Pollution & Treatment Controls | |
| Market Cap ⓘ | $24.71B | |
| Beta ⓘ | 0.78 | |
Value (Cheapness) | ||
| P/E Ratio ⓘ | 25.53 | 22.29 |
| P/B Ratio ⓘ | 8.04 | 1.98 |
| FCF Yield ⓘ | 4.24% | 6.26% |
| Dividend Yield ⓘ | 0.50% | 1.92% |
| EBIT / EV ⓘ | 5.28% | 4.83% |
| PEG ⓘ | 2.27 | |
Growth (Business expansion) | ||
| Revenue Growth ⓘ | 7.50% | 9.30% |
| RPS Growth (5Y CAGR) ⓘ | 3.58% | 7.76% |
| EPS Growth (5Y CAGR) ⓘ | -3.58% | -13.17% |
| BVPS Growth (5Y CAGR) ⓘ | -1.19% | 6.13% |
| Margin Growth (5Y Trend) ⓘ | 0.95% | 0.74% |
| FCF Growth (5Y CAGR) ⓘ | 4.76% | 10.79% |
| DPS Growth (5Y CAGR) ⓘ | N/A | 9.41% |
Quality (Business durability) | ||
| ROIC (Latest) ⓘ | 18.13% | 10.75% |
| ROA (Latest) ⓘ | 12.36% | 5.41% |
| ROIC (5Y Median) ⓘ | 21.27% | 9.37% |
| ROA (5Y Median) ⓘ | 14.86% | 4.95% |
| Net Debt / EBIT (Latest) ⓘ | 0.97 | 2.04 |
| Net Debt / EBIT (5Y Median) ⓘ | 0.51 | 2.27 |
| Net Debt / EBITDA (Latest) ⓘ | 0.90 | 1.39 |
| Net Debt / Assets ⓘ | 14.72% | 19.27% |
| EBITDA / Interest ⓘ | 15.14 | 9.58 |
| Operating Margin (Latest) ⓘ | 22.82% | 10.49% |
| Operating Margin (5Y Median) ⓘ | 22.85% | 10.30% |
| Debt to Equity (Latest) ⓘ | 109.11% | 64.82% |
| Profit Margin (Latest) ⓘ | 17.35% | 6.67% |
| Free Cash Flow (Latest) ⓘ | $1.05B | |
Momentum (Price trend) | ||
| 3Y Return ⓘ | +46.89% | +67.77% |
| 12M Return (excl. last month) ⓘ | -10.49% | +12.05% |
| 6M Return ⓘ | +13.29% | 0.00% |
| Price vs. 200-Day MA ⓘ | +9.37% | +0.67% |
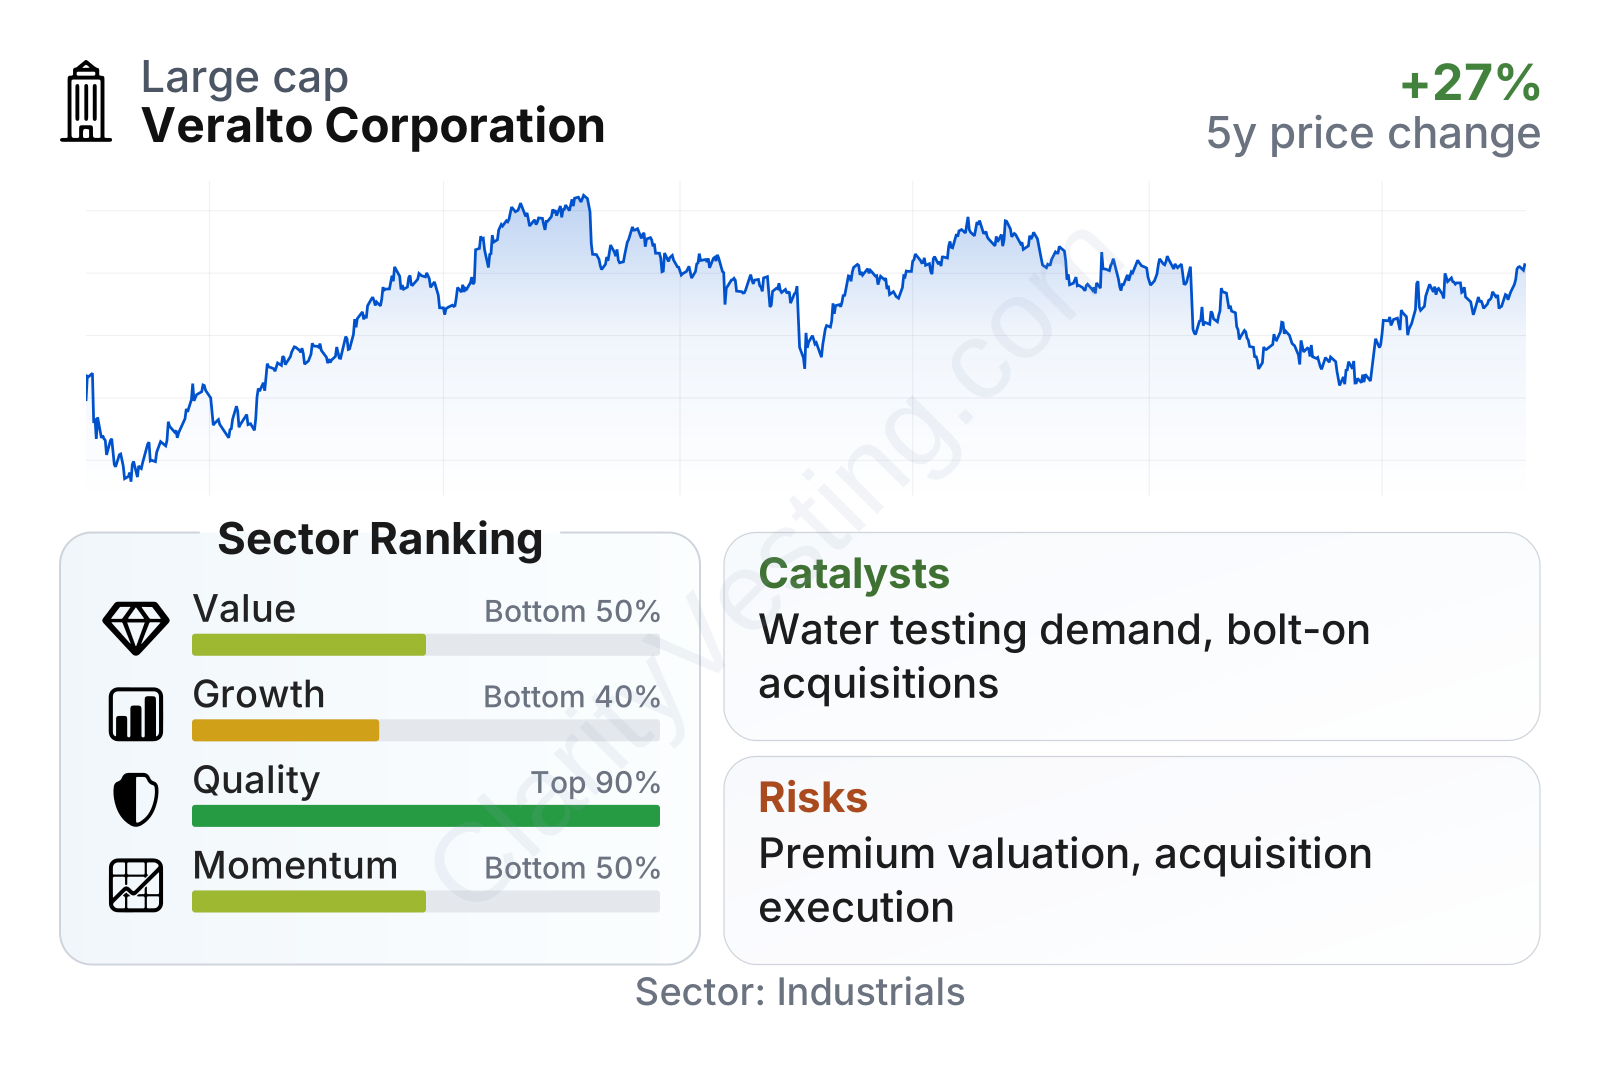
Veralto sits in the large-cap range and has shown lower share-price volatility than the broader market, with a beta below 1. The quality profile stands out: profitability and returns on assets are well above typical sector levels, and leverage measured against earnings remains manageable despite a debt-to-equity ratio that looks elevated. By contrast, the value and growth factors are less favorable, which reflects a stock that has often traded at a premium while revenue growth has been solid rather than exceptional compared with the wider industrial universe.
Growth
Veralto operates in markets with durable long-term demand. Water quality is supported by aging infrastructure, tighter environmental standards, industrial reuse, contamination monitoring, and the global need for safer drinking water. Product identification and inspection also benefit from lasting trends: stricter traceability requirements, automation, premium packaging, anti-counterfeiting efforts, and the need to reduce waste on production lines.
The company’s strategy is coherent for that backdrop. Management has emphasized recurring revenue, disciplined acquisitions, operational improvement, and product innovation across both segments. That approach resembles the playbook used by many high-performing industrial technology businesses: serve mission-critical workflows, keep a high installed base, and earn follow-on revenue through consumables, software, and service.
Recent growth has been steady rather than explosive. Year-over-year revenue growth has generally stayed in the mid-single-digit range and recently moved closer to the high-single-digit area. That suggests healthy demand and decent execution, even if the pace is not far ahead of the stronger parts of the sector.
Cash generation is an important positive point. Free cash flow has improved from the mid-$800 million range to above $1.0 billion on a trailing basis, which supports reinvestment, acquisitions, debt management, and dividends. For a company in infrastructure and industrial technology niches, that kind of conversion is a meaningful sign of business quality.
Recent company updates have also pointed to continued bolt-on acquisition activity and portfolio expansion in water and product quality markets. Those transactions are not transformative on their own, but they fit the company’s model of adding capabilities in fragmented niches where specialized technology and installed relationships matter. In water, regulation and testing intensity remain favorable; in product quality, traceability and coding requirements continue to support demand.
Risks
This article is for informational purposes only and does not constitute financial advice. Some content is AI-generated. See Disclaimer