Stock Analysis · VGP NV (VGPBF)
Overview
VGP NV is a European real estate group focused mainly on logistics and semi-industrial properties. In simple terms, it buys land, develops business parks and warehouses, rents them to tenants, and also earns money by selling completed assets into joint ventures with institutional partners. This gives the company a mix of recurring rental income and more variable profits tied to development and asset recycling.
The business is concentrated in sectors that benefit from long-term demand for modern distribution space, such as e-commerce, manufacturing supply chains, and urban delivery networks. VGP operates across multiple European countries, which helps diversify tenant demand, although it also makes the company sensitive to regional economic conditions and financing markets.
Based on the company’s recent reporting structure and business model, the main sources of revenue and earnings are broadly the following:
- Development and project-related income: a large share of economic value is created by developing logistics and industrial parks, including gains from completion, valuation uplift, and transfers to joint ventures. In many periods, this is the biggest driver of profit, but it can fluctuate materially from year to year.
- Rental income from investment property portfolio: a substantial recurring source tied to leased warehouses, industrial units, and related facilities. This is the more stable part of the model and supports visibility on cash generation.
- Joint venture and asset management income: income linked to partnerships with institutional capital, where VGP develops assets and then monetizes them while often retaining an ongoing role.
- Other property-related services: a smaller contribution that can include ancillary property services, park management, and related activities.
Because VGP’s accounting can include fair-value movements and gains on asset disposals, the profit mix is not as straightforward as that of a plain landlord. Revenue reported under accounting rules can look modest relative to net income when property revaluations and joint venture gains are strong. That is important for long-term readers: this is not just a rent collector, but a developer-owner with a capital recycling model.
The longer-term pattern shows reported revenue rising meaningfully over the past few years, while profitability has been far more volatile because property values, development completions, taxes, and financing costs can swing results from one year to another. More recently, operating income and net income have recovered strongly from the 2022 downturn, helped by improving project economics and portfolio performance.
Key Figures
| Metric | Value | Sector ⓘ |
|---|---|---|
| Date | Oct 17, 2026 | |
| Context | ||
| Sector | Real Estate | |
| Industry | Real Estate Services | |
| Market Cap ⓘ | $2.12B | |
| Beta ⓘ | 1.46 | |
Value (Cheapness) | ||
| P/E Ratio ⓘ | 7.24 | 17.38 |
| P/B Ratio ⓘ | 0.78 | 0.85 |
| FCF Yield ⓘ | 0.69% | 7.38% |
| Dividend Yield ⓘ | 4.86% | 4.85% |
| EBIT / EV ⓘ | N/A | 3.78% |
| PEG ⓘ | N/A | |
Growth (Business expansion) | ||
| Revenue Growth ⓘ | 16.00% | 5.30% |
| RPS Growth (5Y CAGR) ⓘ | 37.40% | 6.02% |
| EPS Growth (5Y CAGR) ⓘ | -3.29% | -11.37% |
| BVPS Growth (5Y CAGR) ⓘ | -0.89% | 0.45% |
| Margin Growth (5Y Trend) ⓘ | 275.14% | -0.22% |
| FCF Growth (5Y CAGR) ⓘ | N/A | 5.40% |
| DPS Growth (5Y CAGR) ⓘ | -0.82% | 5.02% |
Quality (Business durability) | ||
| ROIC (Latest) ⓘ | 15.35% | 5.69% |
| ROE (Latest) ⓘ | 21.08% | 7.56% |
| ROA (Latest) ⓘ | 10.65% | 2.85% |
| ROIC (5Y Median) ⓘ | 2.59% | 4.22% |
| ROE (5Y Median) ⓘ | 11.61% | 6.03% |
| ROA (5Y Median) ⓘ | 5.89% | 2.44% |
| Net Debt / EBIT (Latest) ⓘ | 2.29 | 7.59 |
| Net Debt / EBIT (5Y Median) ⓘ | 8.42 | 8.40 |
| Net Debt / EBITDA (Latest) ⓘ | 2.24 | 5.27 |
| Net Debt / Assets ⓘ | 34.92% | 37.76% |
| EBITDA / Interest ⓘ | 6.69 | 4.10 |
| Operating Margin (Latest) ⓘ | 309.36% | 35.29% |
| Operating Margin (5Y Median) ⓘ | 122.50% | 37.31% |
| Debt to Equity (Latest) ⓘ | 91.08% | 88.87% |
| Profit Margin (Latest) ⓘ | 109.95% | 19.61% |
| Free Cash Flow (Latest) ⓘ | $14.61M | |
Momentum (Price trend) | ||
| 3Y Return ⓘ | -4.86% | +30.75% |
| 12M Return (excl. last month) ⓘ | -15.25% | +4.36% |
| 6M Return ⓘ | -29.16% | -2.52% |
| Price vs. 200-Day MA ⓘ | -27.19% | -2.34% |
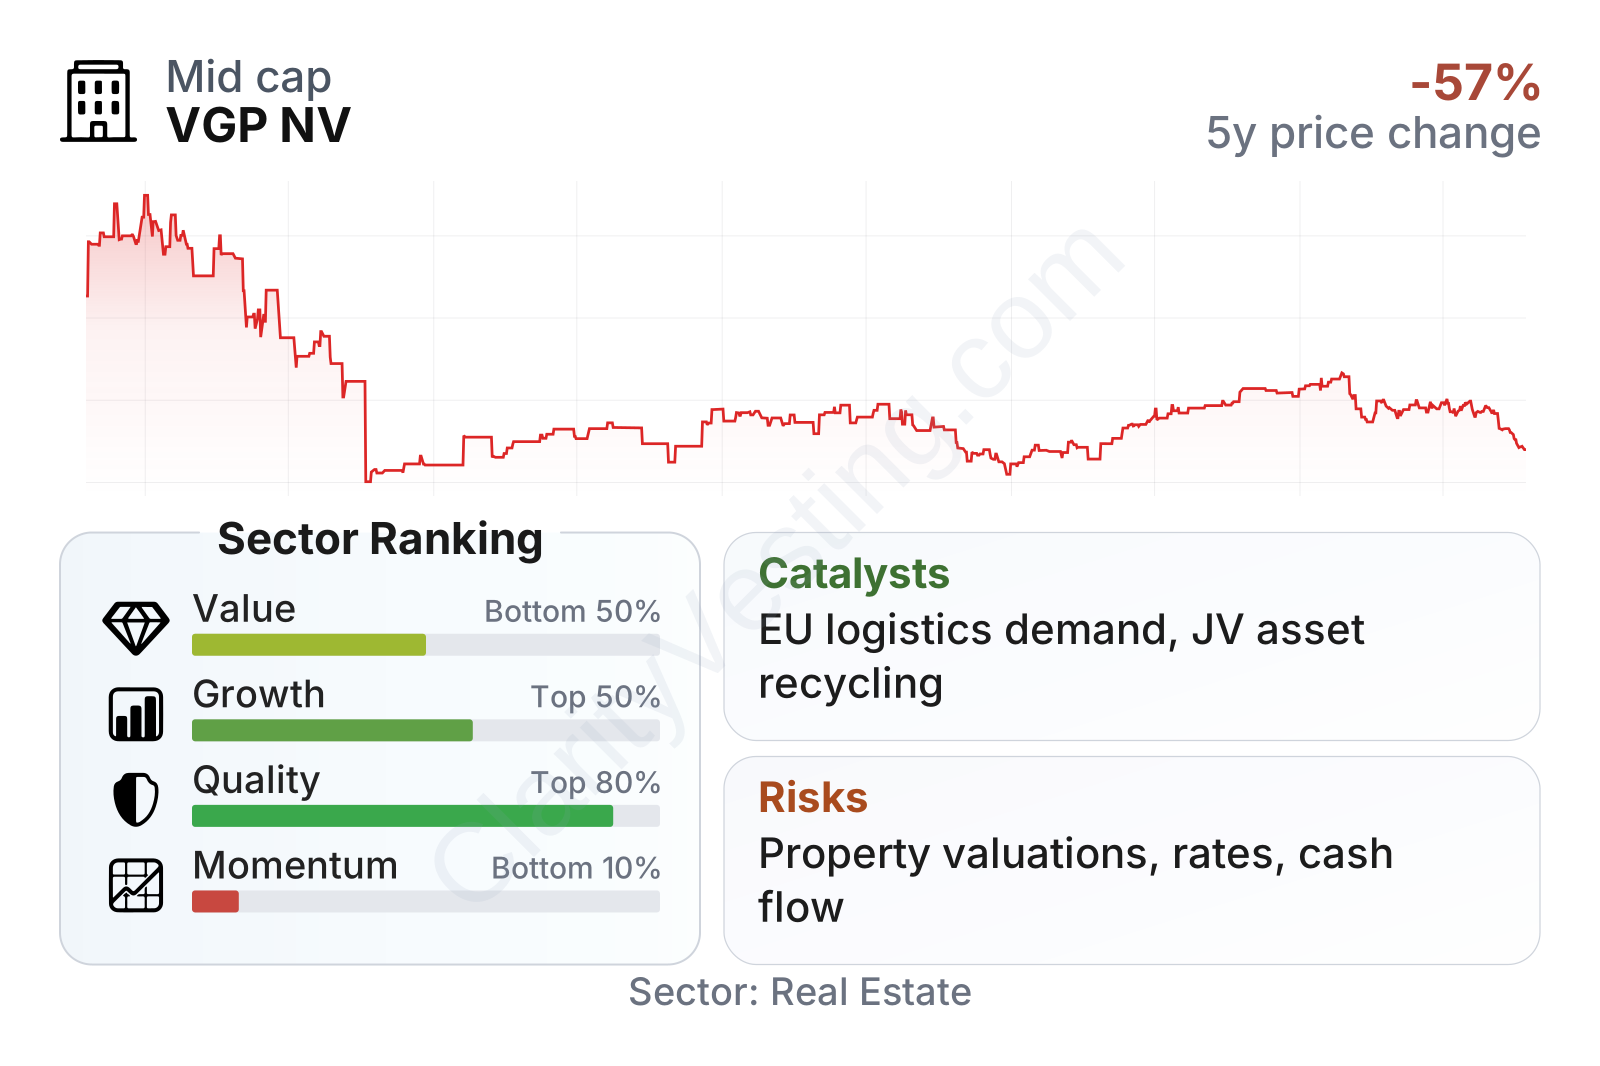
VGP is a mid-sized listed real estate company with a market value around the low single-digit billions of dollars and a share price that has been very volatile since 2021. The stock fell sharply during the European real estate reset and has only partly recovered, which fits with its above-average beta and weaker recent momentum.
On valuation metrics, the shares screen lower than the sector median on earnings and close to the sector median on book value, but that discount comes with an important caveat: real estate earnings can be heavily influenced by property revaluations and deal timing. Cash generation looks much less generous than headline profit, as shown by a free cash flow yield well below the sector median.
Operationally, the picture is stronger. Revenue growth is ahead of the sector median, five-year revenue per share growth is very strong, and recent returns on capital, equity, and assets are all comfortably above typical sector levels. Leverage is meaningful, as expected in property, but current debt ratios and interest coverage look better than many peers. The weakest area is market sentiment: the shares have lagged the broader real estate group over 6 months, 12 months, and 3 years.
Growth
VGP operates in a part of real estate that still has structural support. Modern logistics facilities remain important because companies want faster delivery networks, more resilient supply chains, and better quality industrial space. Demand can cool during weaker economic periods, but the long-term trend toward more efficient distribution infrastructure remains intact across Europe.
Its strategy is also coherent for growth. Rather than simply owning buildings, VGP combines land banking, development, leasing, and partnerships with large capital providers. That model can create growth in several ways at once: rental income can expand as the standing portfolio grows, development profits can be realized as parks are completed, and capital can be recycled into new projects without relying only on balance-sheet expansion.
The increase in revenue per share over the past five years suggests the company has been expanding its economic footprint at a much faster pace than much of the sector. The path has not been perfectly smooth, which is normal for a developer, but the broader direction points to a larger platform and a higher earning base than a few years ago.
The dividend record is more uneven. Payments rose sharply, then dropped, then stabilized around a lower level. That pattern reflects the cyclical and capital-intensive nature of the business. For long-term analysis, this makes VGP less like a bond-like income vehicle and more like a growth-oriented property platform whose distributions can move with development activity, financing conditions, and capital allocation choices.
A meaningful catalyst is the company’s exposure to logistics and industrial real estate in continental Europe, where supply of well-located, modern space can remain tight in many corridors. Another positive factor is the joint venture structure, which gives VGP a route to monetize completed assets and fund new development without having to keep every project on its own balance sheet. If leasing demand stays healthy and yields stabilize, this can support both earnings and net asset value over time.
Recent performance trends also point to a significant opportunity if the broader European property market becomes more favorable. After a difficult 2022, profit recovery in 2023 and 2024, followed by further strength in 2025, suggests that VGP has been able to navigate a tougher funding environment better than some peers. If interest rates continue to normalize, property valuations and transaction activity could become a tailwind rather than a headwind.
Risks
This article is for informational purposes only and does not constitute financial advice. Some content is AI-generated. See Disclaimer


