Stock Analysis · Venture Global Inc (VG)
Overview
Venture Global Inc is a U.S. liquefied natural gas, or LNG, company. In simple terms, it buys or sources natural gas, cools it into liquid form at export terminals on the Gulf Coast, and sells that LNG to customers in international markets. The company has built its model around large-scale export facilities, especially Calcasieu Pass and Plaquemines LNG, while also developing additional capacity for future years. Its business sits in the midstream part of energy: it is less about drilling for gas and more about processing, transporting, and exporting it.
The revenue base is concentrated. Based on the company’s recent annual results and business model, the largest source by far is LNG sales and related gas marketing activity. Venture Global also has service and other revenues tied to terminal operations, but these are much smaller than the core export business.
- LNG sales and natural gas marketing: approximately 95% to 99% of revenue. This includes LNG cargo sales and associated trading or gas procurement activity needed to supply export volumes.
- Terminal services and other revenue: approximately 1% to 5% of revenue. This can include operational services, fees, and other miscellaneous items linked to its facilities.
The broad financial flow also shows how quickly the company has scaled. Revenue was negligible before operations started, then rose into the multi-billion-dollar range as export capacity came online. Profitability has remained strong at the operating level, but the business also carries heavy interest expense because expansion has required very large project financing.
The financial profile highlights a business that moved from pre-revenue development into substantial cash earnings in a short period. At the same time, the rising interest burden and construction spending show that Venture Global is still in an intensive buildout phase rather than a mature steady-state period.
Key Figures
| Metric | Value | Sector ⓘ |
|---|---|---|
| Date | Oct 03, 2026 | |
| Context | ||
| Sector | Energy | |
| Industry | Oil & Gas Midstream | |
| Market Cap ⓘ | $31.35B | |
| Beta ⓘ | N/A | |
Value (Cheapness) | ||
| P/E Ratio ⓘ | 9.80 | 14.47 |
| P/B Ratio ⓘ | 6.60 | 1.70 |
| FCF Yield ⓘ | -30.01% | 8.66% |
| Dividend Yield ⓘ | 0.54% | 3.77% |
| EBIT / EV ⓘ | 8.72% | 7.46% |
| PEG ⓘ | 1.42 | |
Growth (Business expansion) | ||
| Revenue Growth ⓘ | 47.60% | 27.35% |
| RPS Growth (5Y CAGR) ⓘ | N/A | 6.75% |
| EPS Growth (5Y CAGR) ⓘ | 106.23% | -15.45% |
| BVPS Growth (5Y CAGR) ⓘ | N/A | 5.85% |
| Margin Growth (5Y Trend) ⓘ | -29.16% | 0.75% |
| FCF Growth (5Y CAGR) ⓘ | N/A | 3.62% |
| DPS Growth (5Y CAGR) ⓘ | 183.90% | 16.85% |
Quality (Business durability) | ||
| ROIC (Latest) ⓘ | 12.05% | 11.33% |
| ROA (Latest) ⓘ | 6.54% | 6.03% |
| ROIC (5Y Median) ⓘ | N/A | 10.16% |
| ROA (5Y Median) ⓘ | 5.56% | 5.34% |
| Net Debt / EBIT (Latest) ⓘ | 6.26 | 1.62 |
| Net Debt / EBIT (5Y Median) ⓘ | 4.99 | 1.91 |
| Net Debt / EBITDA (Latest) ⓘ | 5.43 | 1.06 |
| Net Debt / Assets ⓘ | 64.41% | 17.29% |
| EBITDA / Interest ⓘ | 4.05 | 9.64 |
| Operating Margin (Latest) ⓘ | 37.31% | 16.32% |
| Operating Margin (5Y Median) ⓘ | 59.90% | 19.53% |
| Debt to Equity (Latest) ⓘ | 499.39% | 54.41% |
| Profit Margin (Latest) ⓘ | 22.05% | 8.79% |
| Free Cash Flow (Latest) ⓘ | -$9.41B | |
Momentum (Price trend) | ||
| 3Y Return ⓘ | N/A | +62.93% |
| 12M Return (excl. last month) ⓘ | +13.38% | +44.83% |
| 6M Return ⓘ | -19.48% | -1.62% |
| Price vs. 200-Day MA ⓘ | +5.87% | +5.18% |
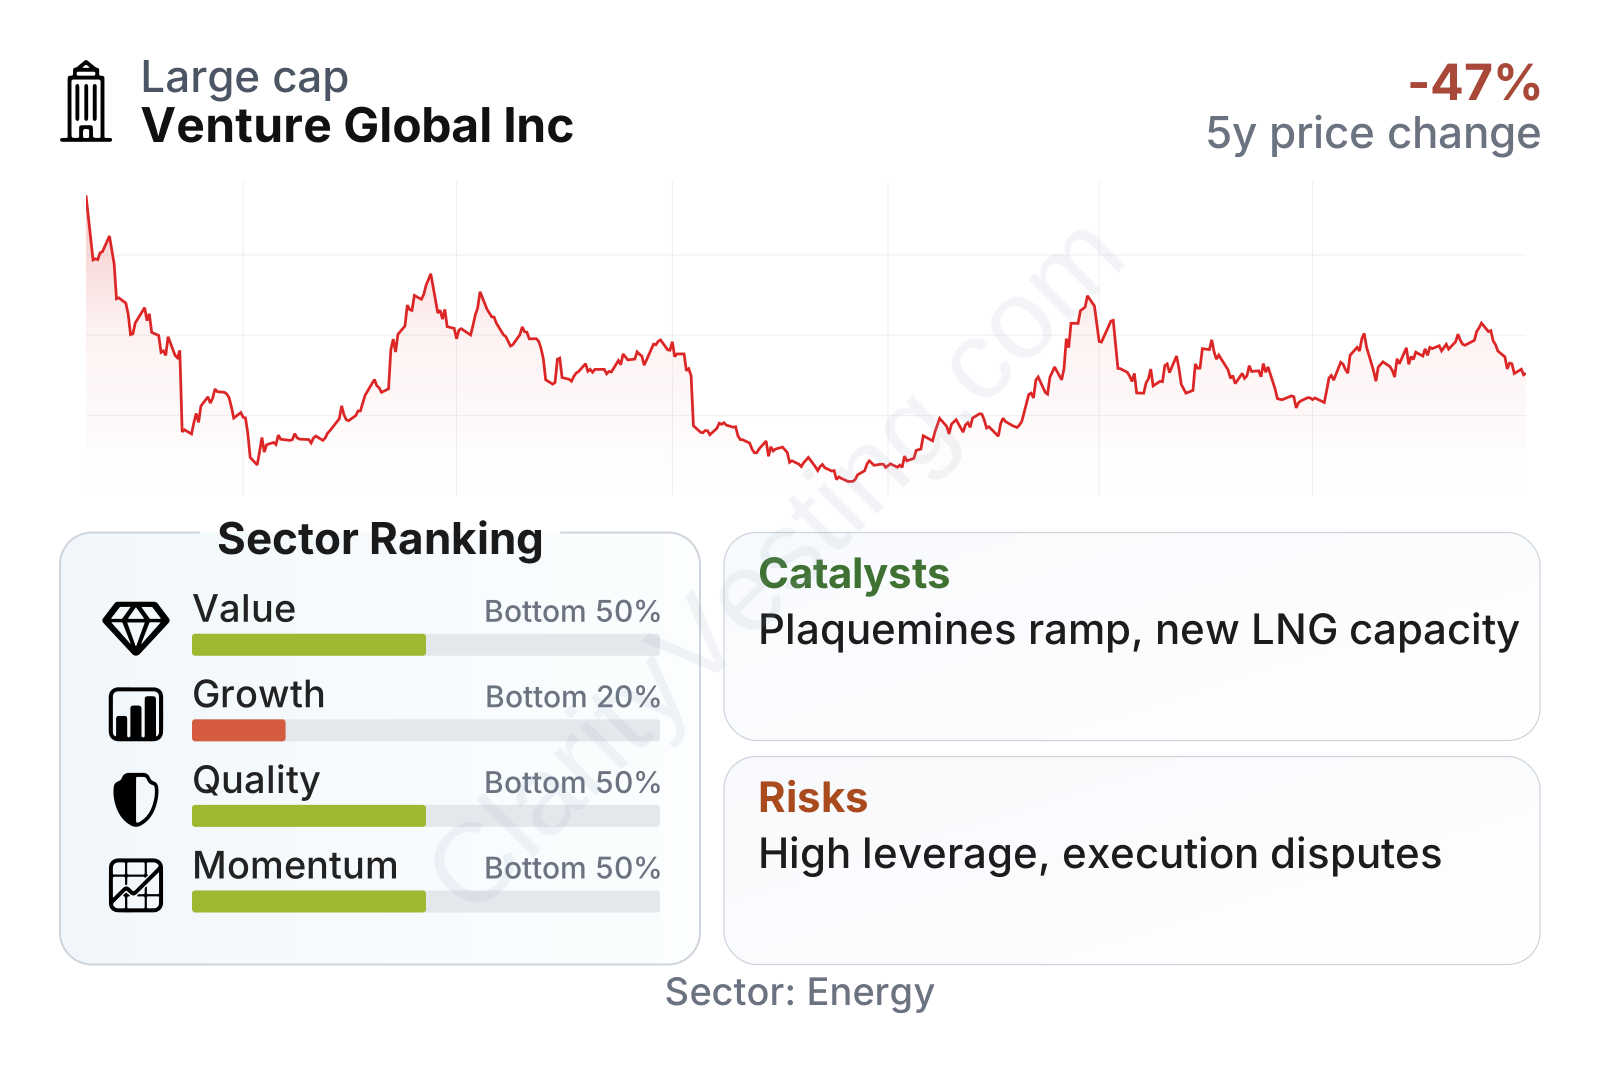
The share price history has been volatile, with a steep drop after the early 2025 period followed by a partial recovery during 2026. That kind of movement usually signals that the market is still trying to determine how to value the company’s mix of rapid growth, high leverage, and major construction execution.
The latest metrics present a mixed picture. On one side, profitability is notably stronger than the sector median, with operating and profit margins well above many midstream peers. Return on invested capital is also slightly ahead of the sector median, suggesting the existing assets can generate attractive earnings once running. On the other side, free cash flow is deeply negative and leverage is far above sector norms, which weighs on both quality and growth rankings. The valuation picture is also unusual: the earnings multiple looks lower than the sector median, but the price-to-book ratio is much higher, reflecting the market’s willingness to pay for future export capacity rather than just current balance-sheet value.
Growth
Venture Global operates in a sector with powerful long-term demand drivers. LNG has become a strategic fuel for countries seeking energy security, supply diversification, and in some cases lower-emission alternatives to coal. Europe’s shift away from Russian pipeline gas, continued demand growth in parts of Asia, and the broader buildout of global regasification capacity all support the need for additional LNG export volumes. The United States is especially well positioned because of abundant natural gas supply and an established Gulf Coast export corridor.
The company’s strategy is straightforward and logical for this backdrop: build export terminals, lock in customers under long-term contracts where possible, and increase scale faster than many rivals. That approach can work well because LNG projects tend to create durable infrastructure with long operating lives. Once built and contracted, they can generate stable cash flow for many years. Venture Global’s opportunity is therefore tied less to finding new products and more to bringing major projects online on time and turning construction assets into producing assets.
Recent revenue growth has been extremely strong, although the pace is naturally moderating from very high early comparisons. Even after that slowdown, growth remains above the sector median, which shows that the company is still expanding from a relatively early operating base rather than moving into a flat mature phase.
The main tradeoff is visible in cash flow. Free cash flow remains deeply negative because the company is spending heavily on new capacity. For an LNG developer, that is not automatically a sign of weak demand or weak economics; it often reflects the fact that cash leaves years before a project produces revenue. The real question is whether those outflows lead to a much larger earnings base later. In Venture Global’s case, that is the central growth thesis.
A key catalyst is the continued ramp-up of Plaquemines LNG and the broader development pipeline beyond current facilities. Additional trains, higher utilization, and new long-term commercial agreements could all increase revenue capacity materially. Public company materials and recent filings also indicate that future expansions remain central to management’s plan, which keeps the company exposed to one of the strongest build cycles in global energy infrastructure.
Risks
This article is for informational purposes only and does not constitute financial advice. Some content is AI-generated. See Disclaimer


