Stock Analysis · Vector Limited (VETTF)
Overview
Vector Limited is a New Zealand infrastructure company whose activities span electricity and gas networks, digital and metering services, and a smaller portfolio of renewable and energy-related businesses. In practical terms, it owns and operates essential assets that move electricity and gas to homes and businesses, while also providing smart metering and other services that support energy retailers and network operators. That gives the company a mix of regulated utility earnings, which are usually steadier, and service-based earnings, which can offer additional growth but may be more variable.
The company’s revenue base is diversified, although not every business line contributes equally. Based on recent annual reporting, the main sources are broadly as follows:
- Electricity distribution and related network services: approximately 35% to 45% of revenue. This includes the regulated Auckland electricity network and associated charges tied to moving power across the grid.
- Gas distribution and gas trading-related activities: approximately 20% to 30% of revenue. This covers gas network operations and energy-market related activities connected to gas supply and infrastructure.
- Metering and digital services: approximately 20% to 30% of revenue. This includes smart meters, data services, and technology platforms used by utilities and retailers.
- Other energy and infrastructure activities: less than 10% to 15% of revenue. This area includes smaller businesses such as renewable and distributed energy initiatives, pipelines, or other support services.
The overall picture is that Vector is not a single-line utility. It is better understood as a core regulated network operator with an extra layer of technology and metering exposure, which slightly broadens its growth profile compared with a traditional local utility.
Recent operating flow also shows a business that remains profitable even when revenue shifts from year to year. Revenue has moved within a relatively narrow range over the last several years, while operating income improved meaningfully in the latest period. Interest expense remains material, which is normal for infrastructure-heavy utilities, but the company’s earnings still converted into solid net income in the most recent year.
Key Figures
| Metric | Value | Sector ⓘ |
|---|---|---|
| Date | Oct 17, 2026 | |
| Context | ||
| Sector | Utilities | |
| Industry | Utilities - Diversified | |
| Market Cap ⓘ | $2.23B | |
| Beta ⓘ | 0.36 | |
Value (Cheapness) | ||
| P/E Ratio ⓘ | 24.78 | 17.28 |
| P/B Ratio ⓘ | 0.76 | 1.51 |
| FCF Yield ⓘ | 6.34% | 0.65% |
| Dividend Yield ⓘ | 9.52% | 3.77% |
| EBIT / EV ⓘ | N/A | 5.01% |
| PEG ⓘ | 2.35 | |
Growth (Business expansion) | ||
| Revenue Growth ⓘ | 6.00% | 6.10% |
| RPS Growth (5Y CAGR) ⓘ | -1.54% | 3.87% |
| EPS Growth (5Y CAGR) ⓘ | -2.06% | -11.30% |
| BVPS Growth (5Y CAGR) ⓘ | 10.58% | 4.23% |
| Margin Growth (5Y Trend) ⓘ | 16.13% | 3.57% |
| FCF Growth (5Y CAGR) ⓘ | N/A | -8.84% |
| DPS Growth (5Y CAGR) ⓘ | 10.67% | 4.84% |
Quality (Business durability) | ||
| ROIC (Latest) ⓘ | N/A | 6.53% |
| ROA (Latest) ⓘ | 5.64% | 3.20% |
| ROIC (5Y Median) ⓘ | 3.72% | 5.95% |
| ROA (5Y Median) ⓘ | 2.38% | 2.75% |
| Net Debt / EBIT (Latest) ⓘ | 2.91 | 7.13 |
| Net Debt / EBIT (5Y Median) ⓘ | 6.00 | 7.23 |
| Net Debt / EBITDA (Latest) ⓘ | 1.83 | 4.31 |
| Net Debt / Assets ⓘ | 32.16% | 38.42% |
| EBITDA / Interest ⓘ | 6.36 | 4.58 |
| Operating Margin (Latest) ⓘ | 34.30% | 20.83% |
| Operating Margin (5Y Median) ⓘ | 27.37% | 20.08% |
| Debt to Equity (Latest) ⓘ | 63.57% | 137.69% |
| Profit Margin (Latest) ⓘ | 20.10% | 11.37% |
| Free Cash Flow (Latest) ⓘ | $141.48M | |
Momentum (Price trend) | ||
| 3Y Return ⓘ | +38.71% | +52.37% |
| 12M Return (excl. last month) ⓘ | +4.02% | +8.84% |
| 6M Return ⓘ | 0.00% | -3.95% |
| Price vs. 200-Day MA ⓘ | 0.00% | -0.79% |
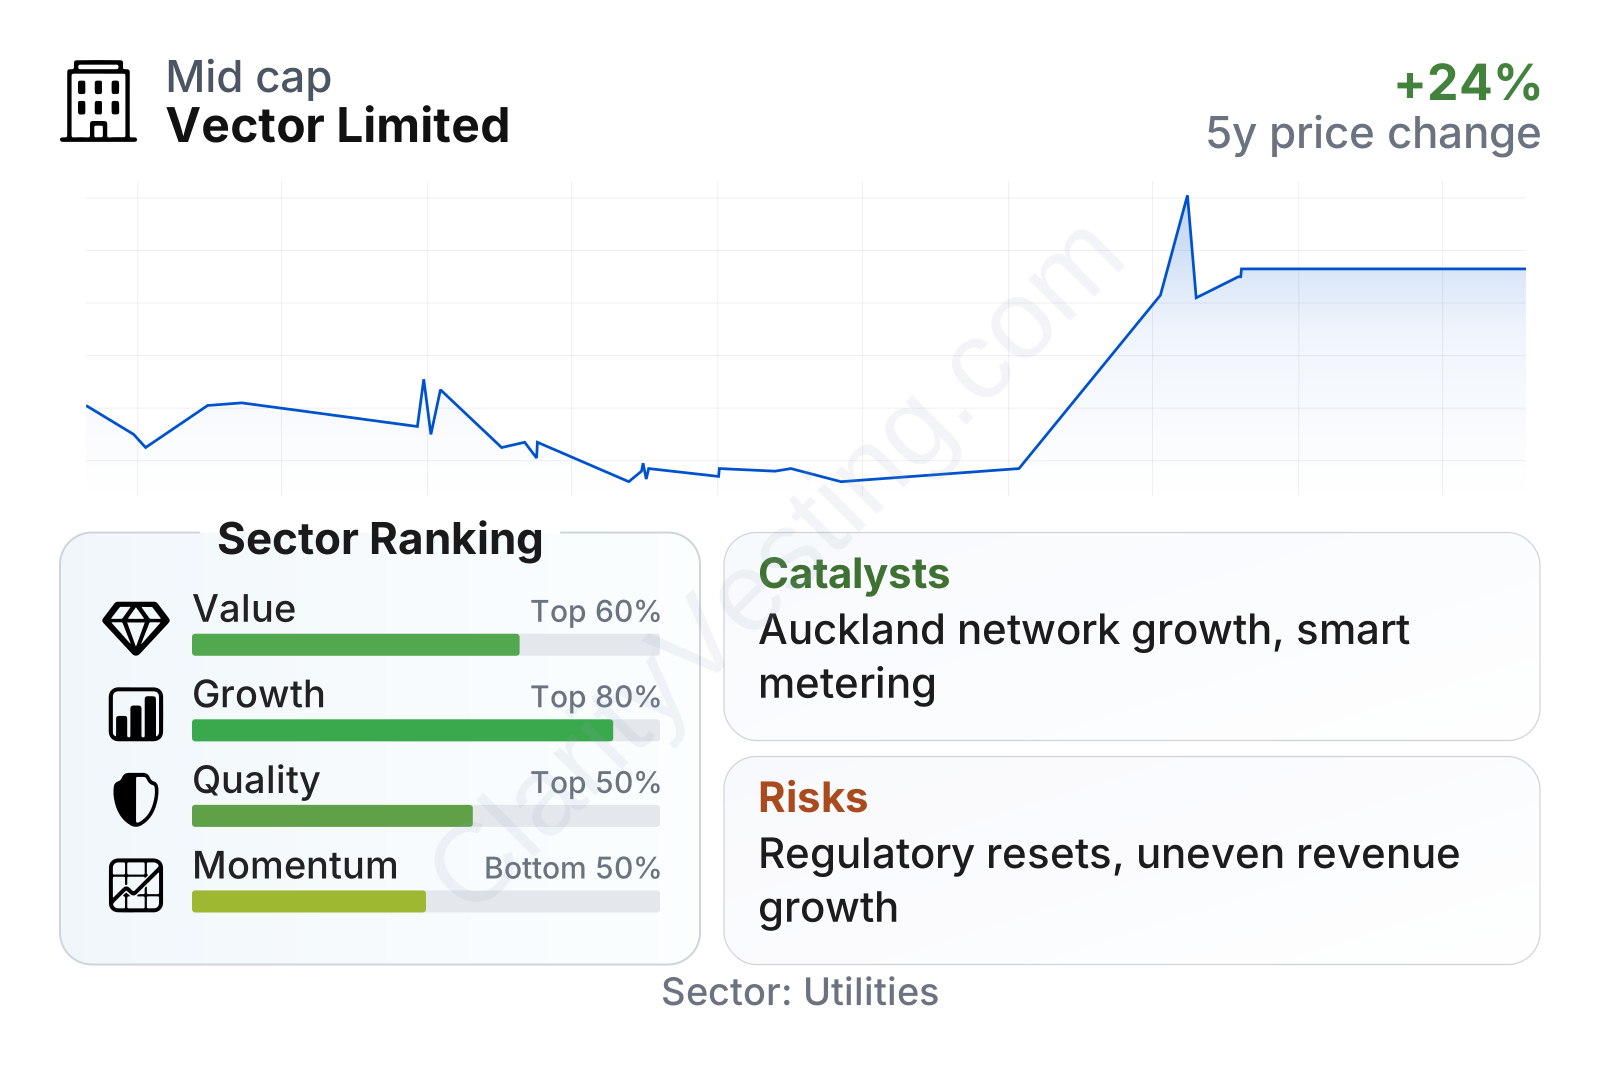
Vector sits in the smaller end of listed utilities by global standards, with a market value around $2 billion and a low beta near 0.36, which points to lower share-price volatility than the broader equity market. The quality profile looks respectable: profitability is above the sector median in several measures, with operating margin around the mid-30% range and profit margin around 20%. Balance-sheet pressure also appears manageable for a utility, with debt-to-equity near 64%, net debt to EBITDA below 2x, and interest coverage above 6x, all better than many sector peers.
The mixed area is growth. Recent year-over-year revenue growth is roughly in line with the sector, but the longer five-year trend in revenue per share has been slightly negative. On the other hand, book value per share, margins, and dividends have grown faster than the sector median, suggesting that value creation has come more from improved efficiency, asset growth, and capital discipline than from consistent top-line expansion. Market performance has been more subdued, with momentum trailing the sector over the last year and over three years.
Growth
Vector operates in a sector with favorable long-term demand drivers. Electricity networks are supported by population growth, rising electrification, data usage, and the gradual shift away from fossil-fuel end uses. Utilities that own urban infrastructure can benefit as power demand becomes more complex, especially with electric vehicles, distributed generation, batteries, and greater digital management of networks. On top of that, smart metering remains a relevant niche because utilities need more data, better billing accuracy, and improved network visibility.
Vector’s strategy makes sense in that context. Its regulated network business provides a stable foundation, while metering and digital operations create a route into faster-moving parts of the energy value chain. That combination is useful because regulated assets alone can be dependable but slow-growing. The added technology exposure gives the company a chance to capture growth from smarter energy systems without abandoning its defensive utility base.
Revenue per share has not followed a straight upward path over the last five years. It declined after 2022, stabilized, dipped again, and then recovered in the latest year. That pattern suggests growth has been uneven rather than absent. Importantly, the latest year shows a rebound, which lines up with stronger operating income and better margins. If that improvement proves durable, it would support the view that recent softness was not purely structural.
A meaningful catalyst is the continued modernization of electricity systems in New Zealand, especially in Auckland, where Vector has a strategically important network footprint. Urban load growth, resilience spending, distributed energy integration, and digital metering upgrades all create room for capital deployment and service expansion. Another positive element is that dividends have increased at a double-digit annualized pace over five years, which usually reflects confidence in cash generation, even if utilities still need heavy reinvestment.
Recent annual results also point to a significant recovery in profitability. Revenue improved in the latest fiscal year, but the bigger change came from stronger operating earnings and net income. For a utility, that matters because modest revenue growth can still translate into better shareholder economics when costs, financing burden, and asset utilization improve.
Risks
This article is for informational purposes only and does not constitute financial advice. Some content is AI-generated. See Disclaimer


