Stock Analysis · Veolia Environnement S.A (VEOEF)
Overview
Veolia Environnement is a global environmental services company focused on three essential activities: water, waste, and energy. In simple terms, it helps cities, industries, and commercial clients manage drinking water and wastewater systems, collect and process waste, and improve energy efficiency through heating, cooling, and facility-related energy services. This makes Veolia part of the broader “environmental infrastructure” space: businesses that provide services society needs regardless of the economic cycle.
The company’s revenue mix is fairly diversified across its main operations and geographies. Based on recent annual reporting, the largest business lines are typically structured as follows:
- Waste management: about 40% to 45% of revenue. This includes waste collection, sorting, recycling, treatment, hazardous waste services, and landfill or recovery operations.
- Water technologies and water services: about 30% to 35% of revenue. This covers drinking water production, wastewater treatment, network management, industrial water solutions, and related technologies.
- Energy services: about 20% to 25% of revenue. This includes district heating and cooling, building energy management, industrial energy efficiency, and local energy infrastructure.
That mix matters because it reduces dependence on a single activity. It also gives Veolia exposure to long-term structural needs: stricter environmental regulation, water scarcity, recycling requirements, industrial decarbonization, and urban infrastructure renewal.
Geographically, Europe remains the core market, with France and the rest of Europe representing the largest share, while the company also has meaningful exposure to North America, Asia, and selected emerging markets. Its customer base is split across municipalities and industrial clients, which adds another layer of diversification.
The multi-year income flow also shows an important pattern: revenue expanded sharply after 2021, then stabilized around the mid-€40 billion range, while operating income and net income continued to improve. In other words, recent progress has come less from pure sales acceleration and more from integration, pricing discipline, efficiency gains, and a gradually stronger profit base.
Key Figures
| Metric | Value | Sector ⓘ |
|---|---|---|
| Date | Oct 10, 2026 | |
| Context | ||
| Sector | Industrials | |
| Industry | Waste Management | |
| Market Cap ⓘ | $26.40B | |
| Beta ⓘ | 0.98 | |
Value (Cheapness) | ||
| P/E Ratio ⓘ | 18.44 | 22.32 |
| P/B Ratio ⓘ | 5.75 | 1.98 |
| FCF Yield ⓘ | 23.99% | 6.34% |
| Dividend Yield ⓘ | 4.37% | 1.95% |
| EBIT / EV ⓘ | N/A | 4.71% |
| PEG ⓘ | 0.96 | |
Growth (Business expansion) | ||
| Revenue Growth ⓘ | 0.70% | 9.25% |
| RPS Growth (5Y CAGR) ⓘ | 6.72% | 7.75% |
| EPS Growth (5Y CAGR) ⓘ | N/A | -13.37% |
| BVPS Growth (5Y CAGR) ⓘ | -24.00% | 6.12% |
| Margin Growth (5Y Trend) ⓘ | 3.15% | 0.81% |
| FCF Growth (5Y CAGR) ⓘ | -17.45% | 11.01% |
| DPS Growth (5Y CAGR) ⓘ | 12.38% | 9.48% |
Quality (Business durability) | ||
| ROIC (Latest) ⓘ | 14.64% | 10.70% |
| ROA (Latest) ⓘ | 3.18% | 5.38% |
| ROIC (5Y Median) ⓘ | 7.09% | 9.26% |
| ROA (5Y Median) ⓘ | 1.28% | 4.94% |
| Net Debt / EBIT (Latest) ⓘ | 2.93 | 2.08 |
| Net Debt / EBIT (5Y Median) ⓘ | 6.20 | 2.29 |
| Net Debt / EBITDA (Latest) ⓘ | 1.50 | 1.43 |
| Net Debt / Assets ⓘ | 22.90% | 19.34% |
| EBITDA / Interest ⓘ | 6.91 | 9.54 |
| Operating Margin (Latest) ⓘ | 6.54% | 10.34% |
| Operating Margin (5Y Median) ⓘ | 6.18% | 10.29% |
| Debt to Equity (Latest) ⓘ | 332.91% | 65.52% |
| Profit Margin (Latest) ⓘ | 2.79% | 6.63% |
| Free Cash Flow (Latest) ⓘ | $6.33B | |
Momentum (Price trend) | ||
| 3Y Return ⓘ | +56.86% | +61.33% |
| 12M Return (excl. last month) ⓘ | +16.12% | +14.82% |
| 6M Return ⓘ | -4.99% | +3.53% |
| Price vs. 200-Day MA ⓘ | -5.96% | +0.88% |
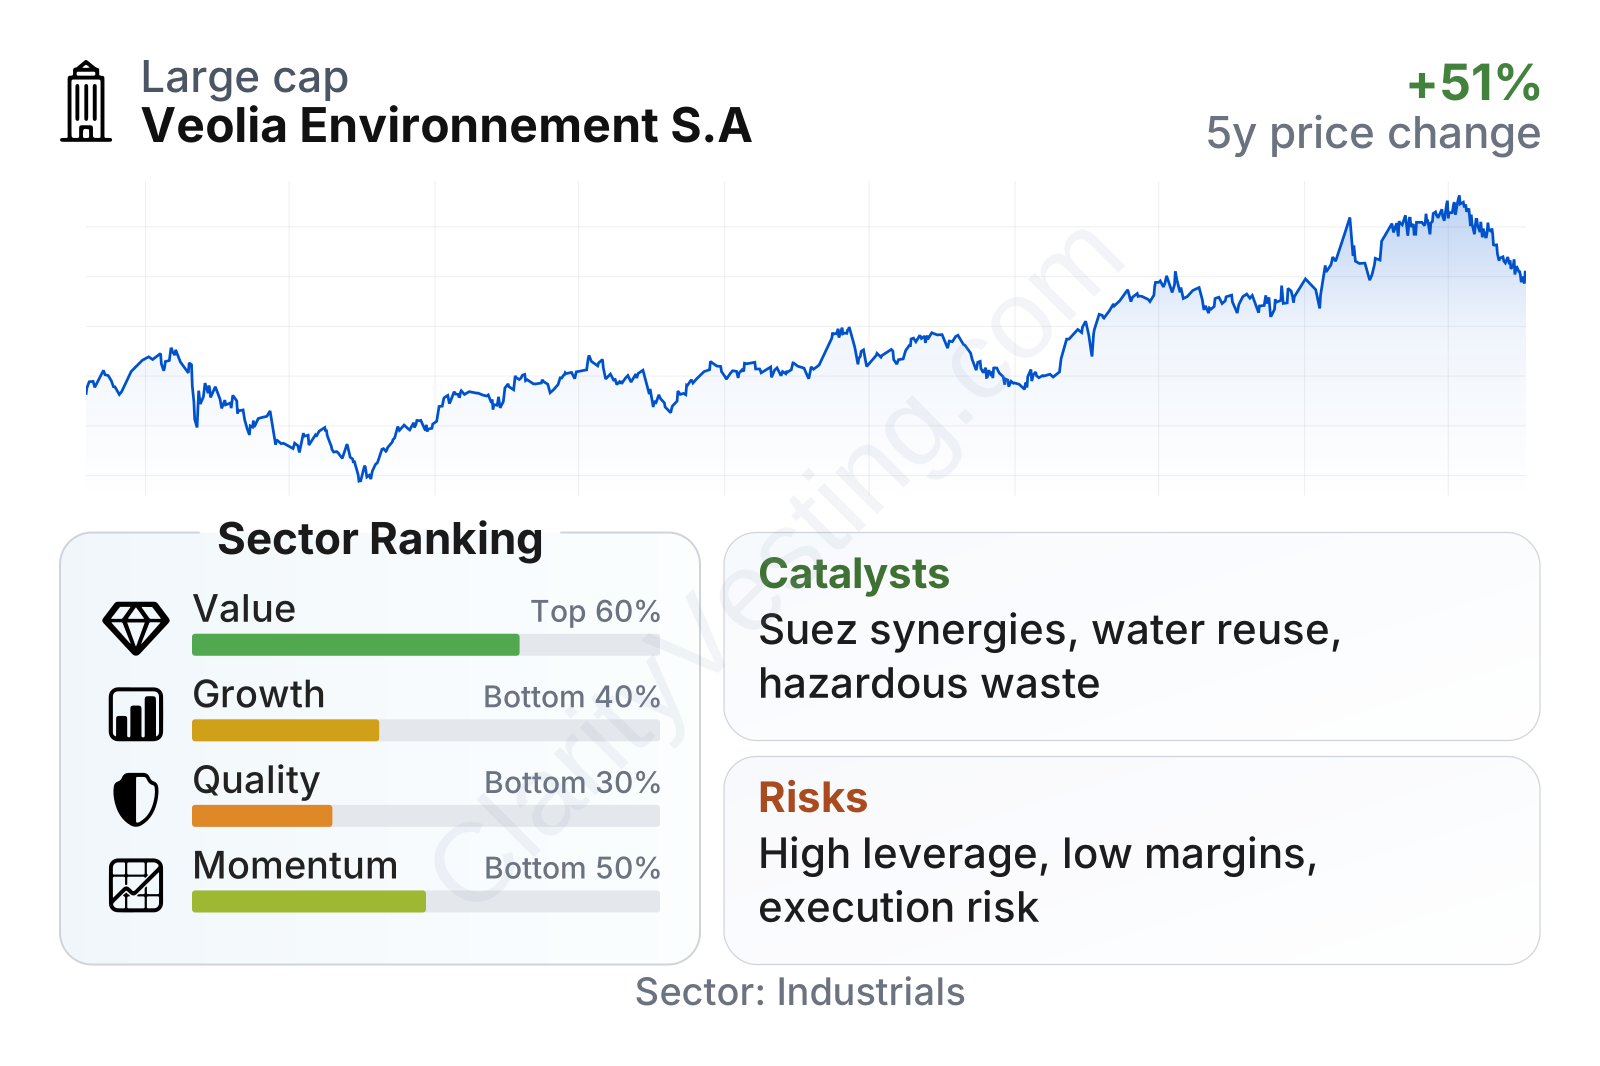
Veolia is a large-cap infrastructure-like services company with share price behavior close to the broader market, as shown by a beta near 1. On valuation factors, it stands in the stronger half of its sector: the earnings multiple is below the sector median, free cash flow yield is well above it, and the dividend yield is also materially higher. The weaker points are growth and balance-sheet-related quality measures. Revenue growth has recently been modest versus the sector, while leverage remains elevated. Profitability has improved over time, but margins are still below many industrial peers.
Growth
Veolia operates in sectors with durable long-term demand. Water treatment, waste recovery, hazardous waste handling, and energy-efficiency services all benefit from regulatory pressure and from physical constraints that are becoming more visible every year. Municipalities need cleaner water systems, industries need to lower emissions and reduce resource consumption, and many countries are pushing harder on recycling and local energy resilience. These are not short-lived trends.
The company’s strategy is broadly aligned with that backdrop. Veolia has been positioning itself less as a basic utility contractor and more as a provider of “ecological transformation” services, especially for industrial clients. That includes water reuse, hazardous waste processing, biomethane, district energy systems, and solutions that turn waste streams into usable materials or energy. These businesses can support steadier demand and, in some niches, better pricing than traditional utility-style contracts.
Recent top-line growth has not been especially strong on a year-over-year basis, and it screens below the sector median. That is an important nuance for long-term analysis: Veolia is not currently a fast-growing industrial name. However, its five-year revenue-per-share growth remains positive, and margin trends over the same period have improved. This suggests the business is relying more on contract quality, synergies, and operating execution than on rapid expansion alone.
Cash generation is a more encouraging part of the picture. Free cash flow is substantial in absolute terms, which is important for a capital-intensive group. Stronger cash conversion can support debt reduction, dividends, and selective investment in higher-value environmental solutions. Dividend growth over the last five years has also been solid, which indicates improving underlying cash capacity even though free cash flow has been uneven over longer periods.
A meaningful catalyst remains the integration and optimization of the Suez combination, which expanded Veolia’s scale and asset base in water and waste. If management continues extracting synergies while keeping contract discipline, that could support earnings even in a lower-growth revenue environment. Another catalyst is industrial demand for specialized treatment and decarbonization services, where customers often need technical expertise and long contract durations rather than simple low-cost providers.
Recent company communications have also emphasized pipeline opportunities tied to water stress, hazardous waste, and energy-efficiency projects. Those themes fit with structural spending priorities in both public infrastructure and industry, making them more durable than cyclical demand spikes.
Risks
This article is for informational purposes only and does not constitute financial advice. Some content is AI-generated. See Disclaimer