Stock Analysis · Veeva Systems Inc (VEEV)
Overview
Veeva Systems is a cloud software company focused mainly on the life sciences industry. In simple terms, it sells digital tools that help pharmaceutical, biotech, and medical device companies manage customer relationships, clinical trials, regulatory documents, quality processes, and large sets of scientific data. Its products are used across the full drug development and commercialization cycle, from research and clinical testing to regulatory approval and sales.
The company’s revenue comes primarily from subscription software, with a smaller contribution from professional services such as implementation, consulting, and support. Based on the latest annual filing for the fiscal year ended January 31, 2026, revenue is organized as follows:
- Subscription services: approximately 82% of revenue. This includes recurring fees for Veeva Commercial Solutions, Veeva R&D Solutions, Veeva Data Cloud, and other cloud applications used by life sciences customers.
- Professional services and other: approximately 18% of revenue. This includes deployment, configuration, training, and advisory work tied to customer adoption of Veeva’s products.
Within subscription revenue, the business mix is increasingly shaped by research-and-development applications rather than only commercial software. Veeva has been expanding from its earlier strength in customer relationship management and field sales tools into clinical, regulatory, safety, quality, and data applications. That shift matters because R&D systems are deeply embedded in customer operations and can create long-lived recurring revenue.
The business model is attractive on the surface: recurring revenue, high gross margins, and customers that operate in a highly regulated industry where switching software can be slow and costly. Over the last five fiscal years, revenue rose from about $1.9 billion to roughly $3.2 billion, while operating income and net income also increased materially. Research and development spending has also climbed steadily, showing that Veeva is still investing heavily while remaining profitable.
The financial flow highlights a software business with expanding scale. Revenue and gross profit have moved up consistently, while research and development remains the largest operating investment, which fits Veeva’s strategy of broadening its product suite without sacrificing profitability.
Key Figures
| Metric | Value | Sector ⓘ |
|---|---|---|
| Date | Oct 24, 2026 | |
| Context | ||
| Sector | Healthcare | |
| Industry | Health Information Services | |
| Market Cap ⓘ | $51.90B | |
| Beta ⓘ | 0.93 | |
Value (Cheapness) | ||
| P/E Ratio ⓘ | 52.55 | 25.42 |
| P/B Ratio ⓘ | 7.16 | 3.08 |
| FCF Yield ⓘ | 3.16% | 3.12% |
| Dividend Yield ⓘ | N/A | 1.85% |
| EBIT / EV ⓘ | 3.41% | 0.56% |
| PEG ⓘ | 1.21 | |
Growth (Business expansion) | ||
| Revenue Growth ⓘ | 17.60% | 7.50% |
| RPS Growth (5Y CAGR) ⓘ | 13.81% | 8.60% |
| EPS Growth (5Y CAGR) ⓘ | 1.88% | -17.73% |
| BVPS Growth (5Y CAGR) ⓘ | 24.57% | 3.72% |
| Margin Growth (5Y Trend) ⓘ | 12.07% | -0.57% |
| FCF Growth (5Y CAGR) ⓘ | 16.59% | 0.96% |
| DPS Growth (5Y CAGR) ⓘ | N/A | 6.69% |
Quality (Business durability) | ||
| ROIC (Latest) ⓘ | 13.23% | 3.17% |
| ROA (Latest) ⓘ | 11.83% | 2.98% |
| ROIC (5Y Median) ⓘ | 13.63% | 4.56% |
| ROA (5Y Median) ⓘ | 11.14% | 1.87% |
| Net Debt / EBIT (Latest) ⓘ | -1.33 | 1.34 |
| Net Debt / EBIT (5Y Median) ⓘ | -1.13 | 1.86 |
| Net Debt / EBITDA (Latest) ⓘ | -1.28 | 1.00 |
| Net Debt / Assets ⓘ | -18.33% | 5.06% |
| EBITDA / Interest ⓘ | N/A | 9.55 |
| Operating Margin (Latest) ⓘ | 36.23% | 9.25% |
| Operating Margin (5Y Median) ⓘ | 25.32% | 7.33% |
| Debt to Equity (Latest) ⓘ | 2.04% | 26.68% |
| Profit Margin (Latest) ⓘ | 29.35% | 3.34% |
| Free Cash Flow (Latest) ⓘ | $1.64B | |
Momentum (Price trend) | ||
| 3Y Return ⓘ | +65.30% | +51.61% |
| 12M Return (excl. last month) ⓘ | -7.19% | +19.90% |
| 6M Return ⓘ | +96.94% | +10.10% |
| Price vs. 200-Day MA ⓘ | +56.01% | +6.44% |
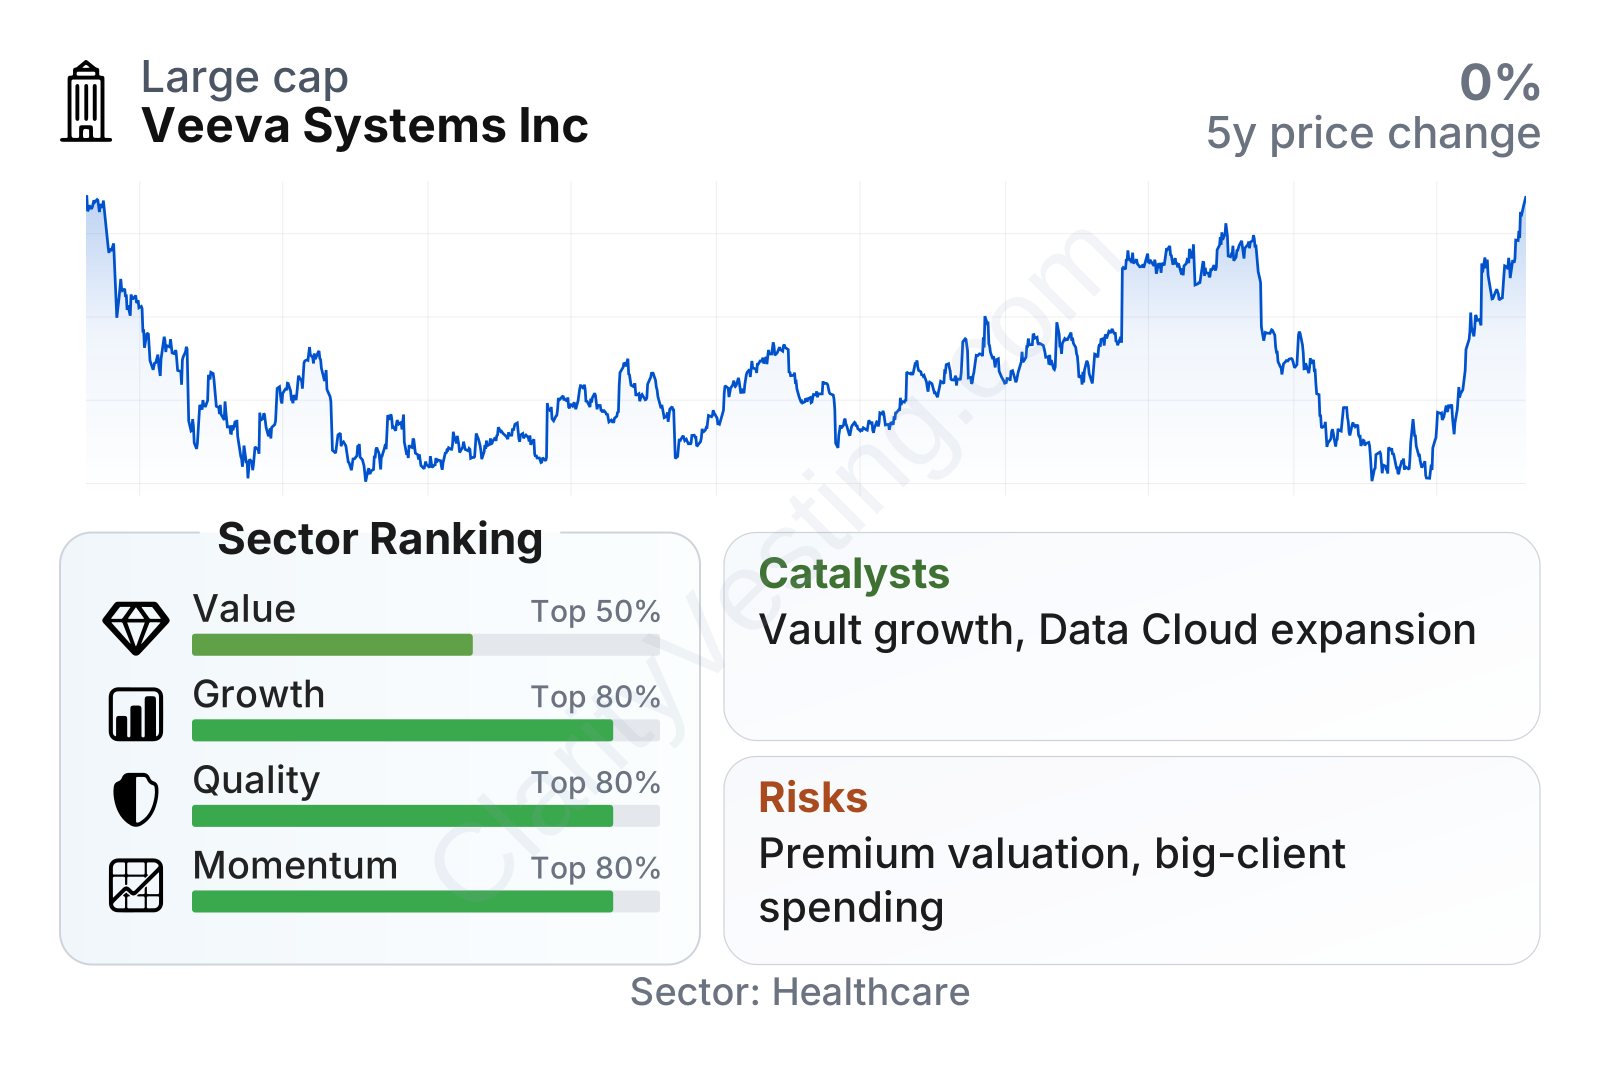
Veeva stands out for business quality more than for low valuation. Its growth profile ranks well within its sector, its profitability is far above typical healthcare information peers, and its balance sheet is unusually strong with very little leverage. The weaker point is valuation: earnings and book value multiples remain above sector norms, even after the stock’s sharp swings over the last few years.
The share price history shows that the market has repeatedly re-rated Veeva, moving from very high multiples in 2021 to much lower levels later on, then recovering again. That pattern suggests the market sees Veeva as a premium company, but not one that is immune to changing growth expectations.
Growth
Veeva operates in a sector with favorable long-term drivers. Life sciences companies continue to digitize research, clinical development, regulatory work, and commercial operations. Drug development is becoming more data-heavy and more complex, while compliance requirements remain strict. That creates demand for specialized software rather than generic tools. Veeva’s focus on one industry gives it an advantage because its products are built around the workflows, terminology, and regulatory needs of life sciences customers.
The company’s strategy also appears coherent. Instead of trying to be a broad enterprise software provider for every industry, Veeva keeps going deeper within life sciences. It has expanded from commercial applications into clinical, regulatory, quality, safety, and data products. That creates cross-selling opportunities: a customer that starts with one system can gradually adopt others across the same platform. This can raise revenue per customer and deepen integration into daily operations.
Revenue growth has normalized from the faster rates seen several years ago, but it has remained consistently solid, recently in the mid-to-high teens year over year. That is still comfortably ahead of the broader sector median and suggests Veeva is gaining from both market expansion and product breadth.
Cash generation has been improving steadily. Free cash flow has climbed from roughly $0.75 billion to nearly $1.4 billion over the last five years, which is important because it shows growth is translating into real financial strength rather than depending on heavy borrowing or weak economics.
A notable catalyst is the continued rollout of products built on the Veeva Vault platform, which has become central to the company’s R&D strategy. Another important development is the company’s work around data offerings, including Veeva Data Cloud, which aims to combine software and data assets for commercial use cases. If adopted broadly, that can increase switching costs and make customer relationships more valuable over time.
Recent company updates have also pointed to continued customer wins and migrations tied to Vault applications and the broader push to unify content and data across clinical and commercial functions. The large installed base among major pharmaceutical companies gives Veeva a strong foundation for additional module sales, especially as customers modernize older systems.
Risks
This article is for informational purposes only and does not constitute financial advice. Some content is AI-generated. See Disclaimer


