Stock Analysis · Victory Capital Holdings Inc (VCTR)
Overview
Victory Capital Holdings is an asset management company. In simple terms, it manages money on behalf of individuals, financial advisors, institutions, retirement plans, and other clients. The company offers investment strategies across stocks, bonds, alternatives, multi-asset portfolios, and specialized mandates. Its business model is straightforward: it gathers assets from clients, invests those assets according to specific strategies, and earns fees based mainly on how much money it manages.
Victory Capital operates through a multi-boutique structure, meaning it owns several investment franchises with distinct brands and teams while using a shared central platform for distribution, operations, technology, and compliance. That setup is designed to combine the appeal of specialized managers with the scale advantages of a larger public company.
Revenue comes primarily from investment advisory and related fees. Based on recent company disclosures, the mix can be summarized approximately as follows:
- Asset-based advisory fees: about 85% to 90% of revenue. These are recurring fees charged on mutual funds, ETFs, separate accounts, and other managed products. This is the core engine of the business.
- Distribution and service fees: about 5% to 10%. These include administrative, shareholder servicing, and certain fund-related support revenues.
- Performance fees and other revenue: about 0% to 5%. This category can include fulcrum fees, performance-linked fees, and smaller miscellaneous sources.
From a client and product perspective, Victory Capital’s revenue is also influenced by where assets sit. Long-term mutual funds, ETFs, separate accounts, and institutional mandates are the main contributors, while money market and lower-fee products generally contribute less revenue per dollar of assets. In practice, this means that not all assets under management are equally valuable: higher-fee active equity and specialized strategies matter more for earnings than lower-fee cash products.
The business has recently become larger and more diversified after acquisitions and strategic partnerships, including the integration of Amundi U.S. and a broader push in exchange-traded funds and solutions for financial intermediaries. That matters because greater scale can improve operating leverage in asset management, where much of the cost base is fixed once the platform is in place.
The broader financial picture shows a business that kept operating margins high through several market environments, while revenue stepped up materially in 2025. The latest period suggests stronger scale, but also a more complex expense base following expansion and integration activity.
Key Figures
| Metric | Value | Sector ⓘ |
|---|---|---|
| Date | Oct 24, 2026 | |
| Context | ||
| Sector | Financial Services | |
| Industry | Asset Management | |
| Market Cap ⓘ | $6.62B | |
| Beta ⓘ | 1.13 | |
Value (Cheapness) | ||
| P/E Ratio ⓘ | 19.82 | 12.46 |
| P/B Ratio ⓘ | 2.84 | 1.25 |
| FCF Yield ⓘ | 8.51% | 9.82% |
| Dividend Yield ⓘ | 1.82% | 2.94% |
| EBIT / EV ⓘ | 8.58% | 8.11% |
| PEG ⓘ | N/A | |
Growth (Business expansion) | ||
| Revenue Growth ⓘ | 24.00% | 9.10% |
| RPS Growth (5Y CAGR) ⓘ | 13.15% | 12.31% |
| EPS Growth (5Y CAGR) ⓘ | -4.26% | -6.97% |
| BVPS Growth (5Y CAGR) ⓘ | 30.64% | 5.02% |
| Margin Growth (5Y Trend) ⓘ | -4.14% | -4.00% |
| FCF Growth (5Y CAGR) ⓘ | -10.16% | 4.71% |
| DPS Growth (5Y CAGR) ⓘ | 39.36% | 8.92% |
Quality (Business durability) | ||
| ROIC (Latest) ⓘ | 14.54% | 9.18% |
| ROE (Latest) ⓘ | 19.31% | 13.93% |
| ROA (Latest) ⓘ | 10.99% | 1.57% |
| ROIC (5Y Median) ⓘ | 15.21% | 7.80% |
| ROE (5Y Median) ⓘ | 26.57% | 12.15% |
| ROA (5Y Median) ⓘ | 10.76% | 1.28% |
| Net Debt / EBIT (Latest) ⓘ | 1.47 | 1.02 |
| Net Debt / EBIT (5Y Median) ⓘ | 2.39 | 0.72 |
| Net Debt / EBITDA (Latest) ⓘ | 1.30 | 0.88 |
| Operating Margin (Latest) ⓘ | 41.19% | 22.30% |
| Operating Margin (5Y Median) ⓘ | 42.95% | 24.50% |
| Debt to Equity (Latest) ⓘ | 42.62% | 59.34% |
| Profit Margin (Latest) ⓘ | 29.57% | 26.42% |
| Free Cash Flow (Latest) ⓘ | $563.22M | |
Momentum (Price trend) | ||
| 3Y Return ⓘ | +305.96% | +95.73% |
| 12M Return (excl. last month) ⓘ | +62.87% | +17.30% |
| 6M Return ⓘ | +44.68% | +6.07% |
| Price vs. 200-Day MA ⓘ | +23.04% | +5.36% |
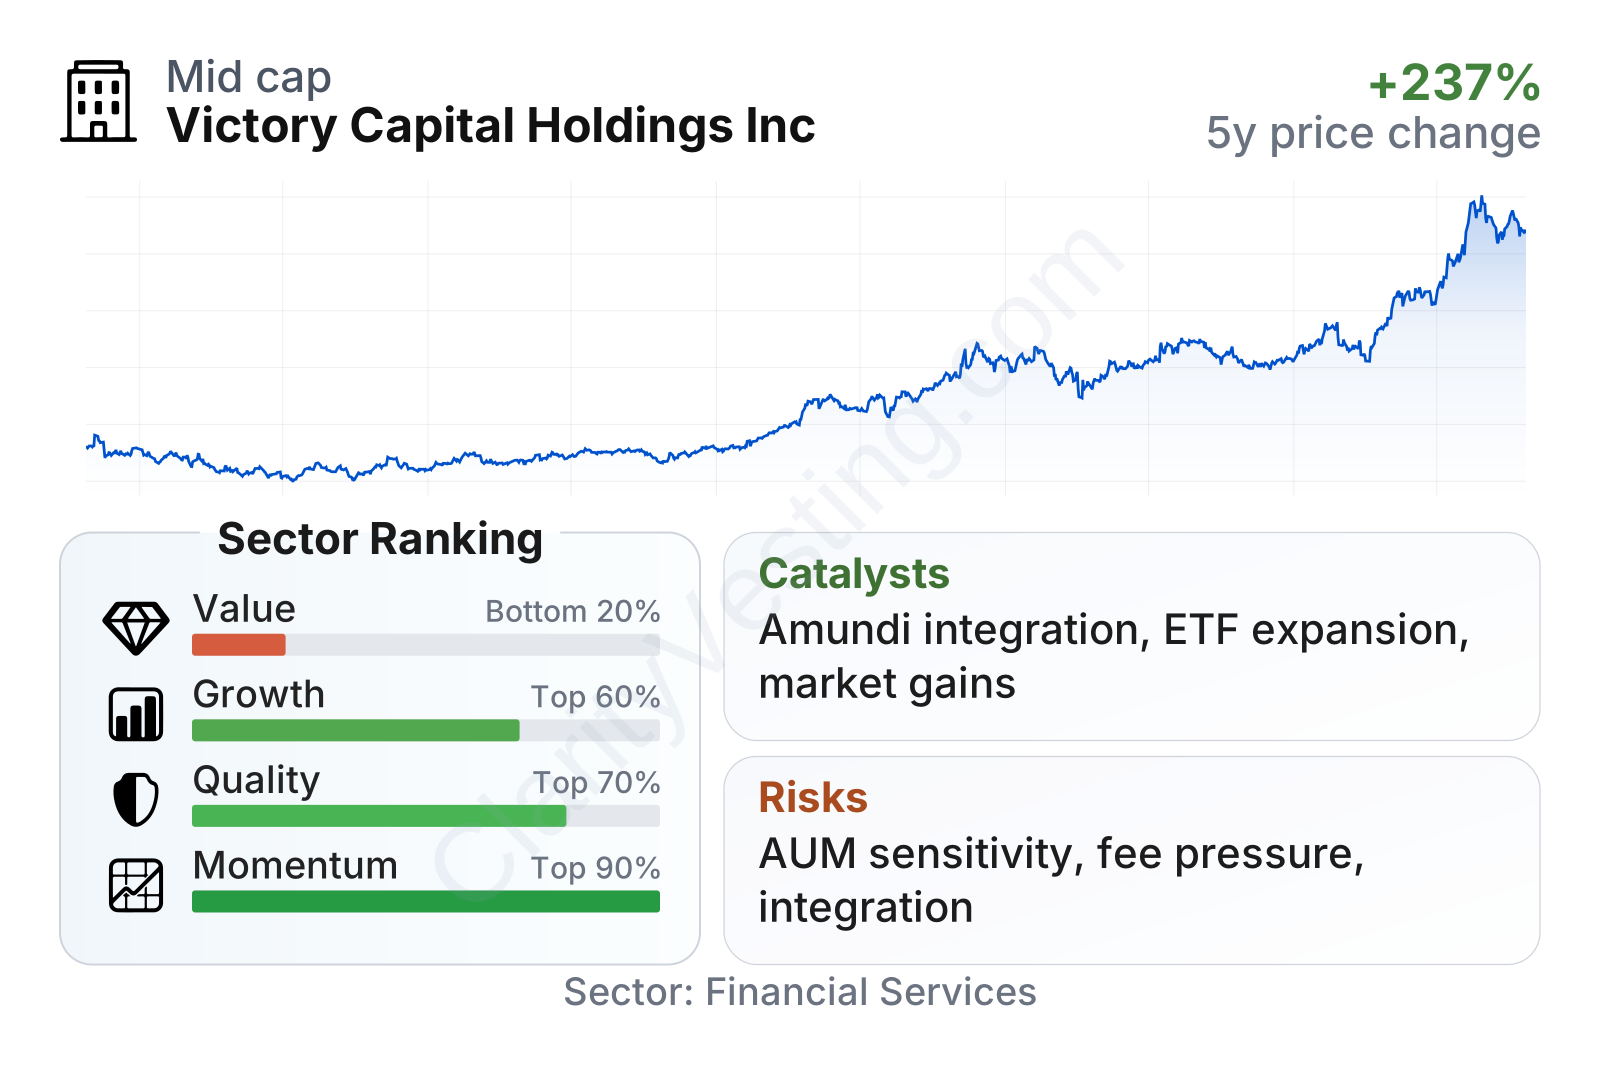
Victory Capital is a mid-sized listed asset manager with a market value around the upper single-digit billions of dollars. Recent share performance has been very strong relative to much of the financial sector, and the company ranks well on momentum, growth, and quality measures. Revenue growth has been clearly above the sector median, while profitability remains strong, with operating margin around 41% and profit margin near 30%.
Return metrics also stand out. Return on equity is near 19% and return on assets is close to 11%, both well above typical sector levels. At the same time, valuation screens less attractively than many peers: the earnings multiple and especially the price-to-book multiple sit above sector medians, which suggests the market is already giving credit for the company’s profitability and recent expansion.
Cash generation remains meaningful, with free cash flow in the hundreds of millions of dollars, though the recent free-cash-flow yield is somewhat below the sector median. That combination usually describes a business with solid economics but a stock that is no longer overlooked.
Growth
Asset management is a sector with long-term structural support, although it is not a straight-line growth market. Over time, retirement saving, the expansion of fee-based financial advice, greater ETF adoption, and rising demand for outsourced investment management all support industry growth. Victory Capital is positioned in several of those areas, especially through its diversified product lineup and its distribution relationships with advisors and institutions.
The company’s strategy is coherent for future growth. Its model combines specialized investment teams with a centralized operating platform, which can make acquisitions easier to integrate and can improve margins as assets scale. This approach has already been used multiple times. The company has also been expanding its ETF presence, an important area because client demand has increasingly shifted toward exchange-traded vehicles, even within active management.
A major recent catalyst has been the Amundi U.S. acquisition and partnership, which added significant scale and broadened distribution. Victory Capital has emphasized the benefits of combining Amundi’s U.S. retail and institutional capabilities with its own operating model. If integration continues to go well, that deal can support both higher assets under management and better operating leverage over time.
Another useful signal is earnings progression. After a flatter period earlier in the decade, earnings per share improved meaningfully in 2024 and 2025, showing that higher scale and stronger markets can translate into better bottom-line results.
Book value per share has also risen sharply over the last five years, especially after the latest step-up. That suggests the company has been building equity value even while returning cash to shareholders through dividends and repurchases.
There are also broader business catalysts beyond acquisitions. Victory Capital benefits when equity and fixed-income markets rise, because higher asset values generally lift fee revenue without requiring matching cost increases. It also benefits when net client flows are positive, particularly into higher-fee strategies, and when advisors consolidate around larger product platforms that can offer mutual funds, ETFs, separate accounts, and model-based solutions in one place.
Risks
This article is for informational purposes only and does not constitute financial advice. Some content is AI-generated. See Disclaimer


