Stock Analysis · Visa Inc (V)
Overview
Visa operates one of the world’s largest electronic payments networks. It does not mainly act like a traditional bank that lends money from its own balance sheet. Instead, it connects consumers, merchants, banks, fintechs, governments, and payment processors so that digital transactions can move securely across its network. In simple terms, Visa earns money when more payments flow through its system, whether those purchases happen in stores, online, domestically, or across borders.
Its business is highly scalable because each additional transaction adds revenue without requiring a similar increase in costs. That is why Visa has historically converted a large share of revenue into profit and cash flow. The company’s role in the payment chain also gives it broad exposure to long-term themes such as the decline of cash, growth in e-commerce, international travel recovery, and the spread of digital wallets and real-time payment tools.
Based on Visa’s recent annual reporting structure, revenue comes from four main streams:
- Service revenues: about 31% — fees earned mainly for services provided to clients, largely based on payment volume on Visa-branded cards and credentials.
- Data processing revenues: about 39% — fees tied to the number of processed transactions, including authorization, clearing, settlement, network access, and related switching services.
- International transaction revenues: about 28% — fees generated from cross-border activity, including transactions where the country of the merchant and the card issuer differ, plus currency conversion-related activity.
- Other revenues: about 2% — value-added services and smaller business lines not included in the three core categories.
One important offset to gross revenue is client incentives, which are payments and rebates Visa provides to issuers, merchants, and partners to win or renew business. These incentives are significant and are deducted from gross revenue to reach net revenue, so they are an important part of understanding the economics of the business.
Over the last five years, Visa’s revenue has risen from about $24 billion to about $40 billion, while net income expanded from roughly $12 billion to about $20 billion. Costs have increased too, but much more slowly than revenue for most of that period, which helps explain the company’s unusually high margin profile.
The overall pattern is clear: revenue and profit have both grown strongly over time, and the business still keeps a very large share of each dollar of sales after operating expenses. The one point to watch is that expense growth accelerated in the most recent fiscal year, which can limit margin expansion if it continues.
Key Figures
| Metric | Value | Sector ⓘ |
|---|---|---|
| Date | Oct 17, 2026 | |
| Context | ||
| Sector | Financial Services | |
| Industry | Credit Services | |
| Market Cap ⓘ | $734.85B | |
| Beta ⓘ | 0.77 | |
Value (Cheapness) | ||
| P/E Ratio ⓘ | 33.71 | 12.26 |
| P/B Ratio ⓘ | 21.97 | 1.23 |
| FCF Yield ⓘ | 2.86% | 10.40% |
| Dividend Yield ⓘ | 0.68% | 3.02% |
| EBIT / EV ⓘ | 4.03% | 8.14% |
| PEG ⓘ | 1.64 | |
Growth (Business expansion) | ||
| Revenue Growth ⓘ | 14.40% | 9.35% |
| RPS Growth (5Y CAGR) ⓘ | 16.57% | 12.19% |
| EPS Growth (5Y CAGR) ⓘ | 6.88% | -9.53% |
| BVPS Growth (5Y CAGR) ⓘ | 5.15% | 4.99% |
| Margin Growth (5Y Trend) ⓘ | -6.81% | -3.86% |
| FCF Growth (5Y CAGR) ⓘ | 10.41% | 4.81% |
| DPS Growth (5Y CAGR) ⓘ | 16.52% | 8.79% |
Quality (Business durability) | ||
| ROIC (Latest) ⓘ | 38.88% | 9.49% |
| ROE (Latest) ⓘ | 61.55% | 13.90% |
| ROA (Latest) ⓘ | 23.26% | 1.55% |
| ROIC (5Y Median) ⓘ | 30.37% | 7.86% |
| ROE (5Y Median) ⓘ | 47.20% | 12.17% |
| ROA (5Y Median) ⓘ | 19.63% | 1.30% |
| Net Debt / EBIT (Latest) ⓘ | 0.41 | 0.96 |
| Net Debt / EBIT (5Y Median) ⓘ | 0.27 | 0.73 |
| Net Debt / EBITDA (Latest) ⓘ | 0.40 | 0.92 |
| Operating Margin (Latest) ⓘ | 62.39% | 22.30% |
| Operating Margin (5Y Median) ⓘ | 66.40% | 24.63% |
| Debt to Equity (Latest) ⓘ | 67.82% | 58.56% |
| Profit Margin (Latest) ⓘ | 50.78% | 26.57% |
| Free Cash Flow (Latest) ⓘ | $21.01B | |
Momentum (Price trend) | ||
| 3Y Return ⓘ | +70.36% | +88.33% |
| 12M Return (excl. last month) ⓘ | +11.67% | +19.38% |
| 6M Return ⓘ | +27.04% | +4.75% |
| Price vs. 200-Day MA ⓘ | +18.24% | +3.50% |
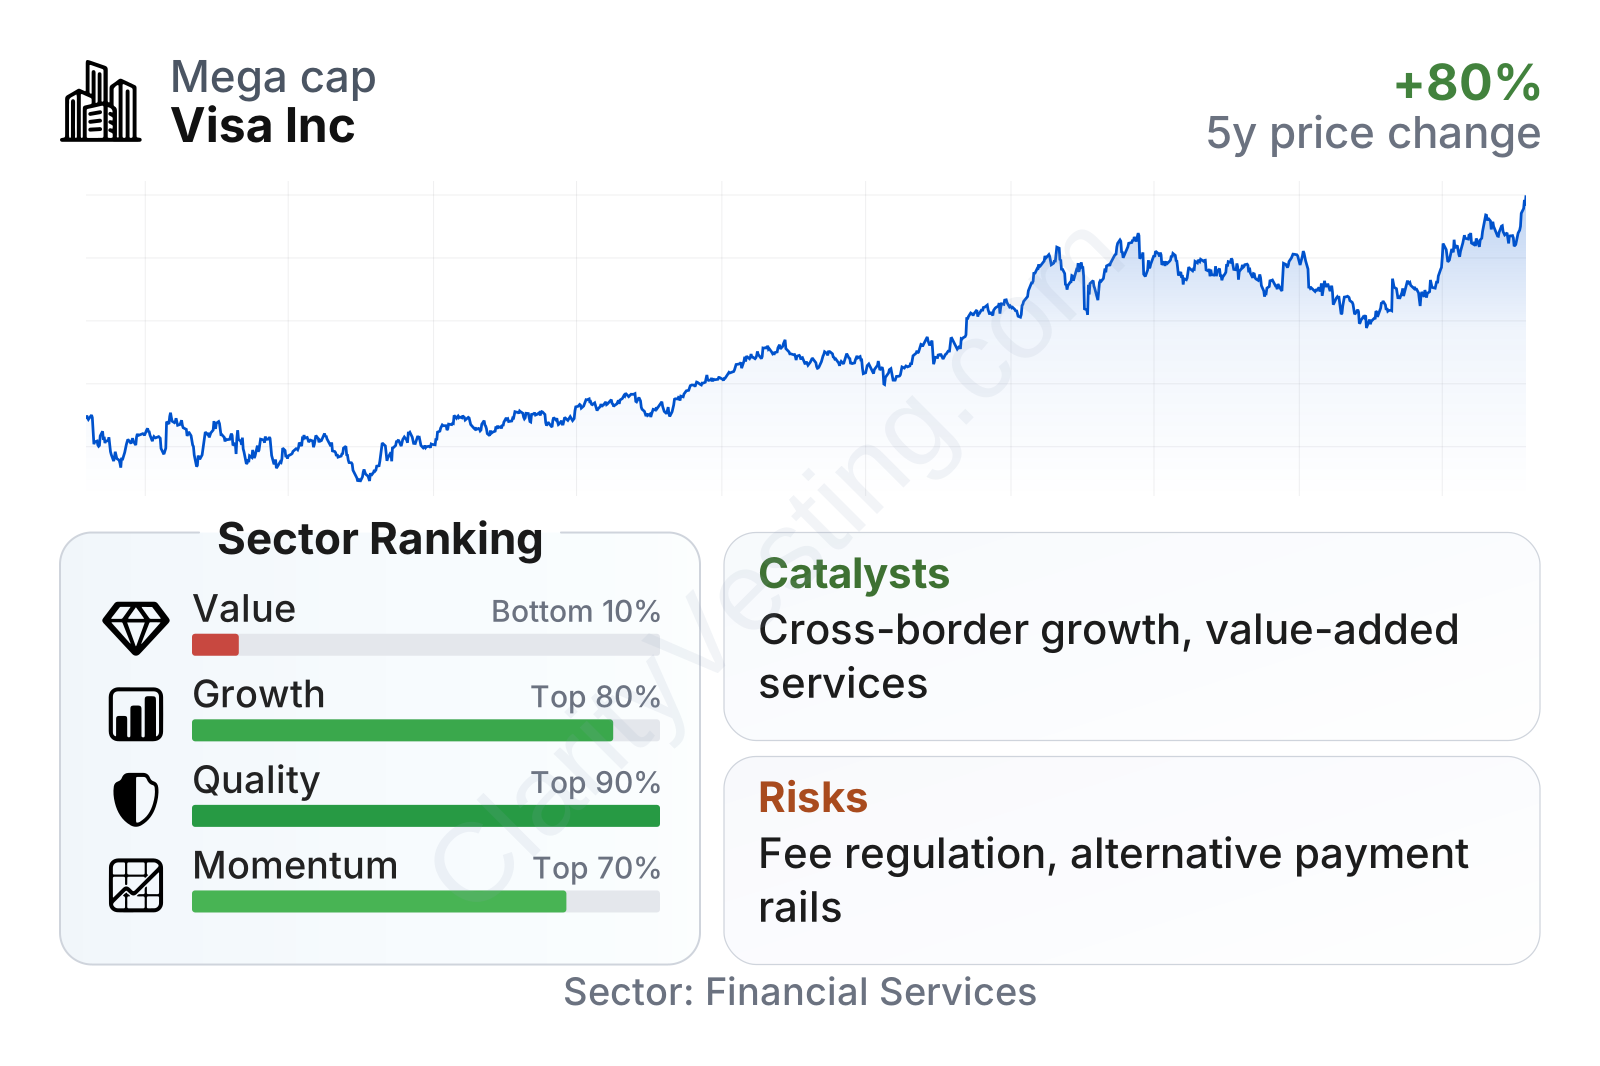
Visa stands out for quality and consistency more than for cheapness. Relative to most financial-services companies, profitability ratios are exceptionally strong, growth remains solid, and balance-sheet leverage is manageable. The trade-off is valuation: the shares screen as expensive on earnings, book value, and cash flow compared with the sector median. Price momentum is mixed over longer periods, although the recent medium-term trend has been constructive.
Visa is also a very large company with a below-market beta, which fits its reputation as a steady compounder rather than a highly volatile name. Free cash flow remains substantial, supporting buybacks, dividends, and ongoing investment in the network.
Growth
Visa operates in a sector that still has room to expand over many years. Cash usage continues to decline in many markets, digital commerce keeps gaining share, and many transactions that were once offline or manual are moving onto electronic rails. Even in developed economies, the payments mix keeps shifting toward cards, wallets, tokenized credentials, and embedded checkout experiences. In emerging markets, the runway is often longer because cash remains more common and digital acceptance is still building out.
Visa’s strategy broadly aligns with those trends. Management has been pushing beyond the classic card swipe into value-added services, tokenization, fraud prevention, dispute solutions, data tools, commercial payments, and money movement between individuals, businesses, and institutions. That matters because it reduces reliance on pure consumer card spending and gives the company more ways to grow even if traditional card volumes mature in some regions.
Cross-border payments remain one of the strongest long-term opportunities. This part of the business tends to carry attractive economics, and it benefits from international travel, global e-commerce, and business-to-business activity. Visa is also trying to deepen its role in flows that are larger than card purchases alone, such as account-to-account transfers, remittances, and business disbursements.
Earnings per share moved up strongly from 2021 through 2025, which reflects both revenue growth and powerful operating leverage. The more recent trailing figure is below the last full fiscal-year level, so the near-term pace should be watched, but the multiyear direction still points to a business that has been compounding profit at a healthy rate.
Book value per share has also trended upward, although more slowly than earnings. That is not unusual for a company like Visa because it returns a large amount of cash through share repurchases and dividends. For this business, earnings power and cash generation are usually more informative than book value alone.
A meaningful recent opportunity comes from Visa’s continued expansion in value-added services and digital credentials. As fraud prevention, tokenization, and secure checkout become more important to merchants and issuers, Visa can monetize more than just transaction routing. The company has also been building out products for real-time payments and broader money movement, which could enlarge its addressable market over time if adoption keeps improving.
Risks
This article is for informational purposes only and does not constitute financial advice. Some content is AI-generated. See Disclaimer


