Stock Analysis · United States Cellular Preferred due (UZE)
Overview
United States Cellular Preferred due, traded under the symbol UZE, is not a common operating stock in the usual sense. It is a preferred security tied to United States Cellular Corporation, the regional wireless carrier better known as U.S. Cellular. For long-term analysis, the underlying business matters more than the label on the security: U.S. Cellular provides wireless service, sells devices, and supports those services with network infrastructure across selected U.S. markets.
The company’s business has historically centered on mobile connectivity for consumers and businesses. That includes monthly wireless plans, equipment sales such as smartphones and tablets, and related service revenue. Public filings also show a smaller contribution from towers and other business activities. In practical terms, the business depends on keeping subscribers, managing network spending, and competing against much larger national carriers.
Based on recent company reporting, the main revenue sources have been roughly organized as follows:
- Service revenue: approximately 65% to 75% of total revenue. This usually includes recurring wireless plan charges, roaming, and other subscriber-related fees.
- Equipment sales: approximately 20% to 30% of total revenue. This covers handsets, tablets, accessories, and upgrade activity.
- Other revenue: generally below 10%. This can include tower-related activity, leased infrastructure, and miscellaneous items.
That mix is important because recurring service revenue is normally more stable than device sales, while equipment revenue can be more volatile and carries lower profitability. Over the last several years, the underlying business has shown pressure on total revenue, while profitability has fluctuated meaningfully.
The operating flow also shows a business with a still sizeable gross profit base, but one that has struggled to translate that consistently into net earnings. Revenue declined from a little above $4.1 billion in 2021 to about $3.8 billion in 2024, while operating income and net income became more uneven. The very sharp change shown for 2025 appears tied to a major corporate event or reporting change rather than a normal year of operations, so it should not be read as a standard continuation of earlier trends.
Key Figures
| Metric | Value | Sector ⓘ |
|---|---|---|
| Date | Oct 17, 2026 | |
| Context | ||
| Sector | Real Estate | |
| Industry | REIT - Residential | |
| Market Cap ⓘ | $2.74B | |
| Beta ⓘ | N/A | |
Value (Cheapness) | ||
| P/E Ratio ⓘ | N/A | 17.38 |
| P/B Ratio ⓘ | 1.07 | 0.85 |
| FCF Yield ⓘ | -7.41% | 7.38% |
| Dividend Yield ⓘ | N/A | 4.85% |
| EBIT / EV ⓘ | N/A | 3.78% |
| PEG ⓘ | N/A | |
Growth (Business expansion) | ||
| Revenue Growth ⓘ | N/A | 5.30% |
| RPS Growth (5Y CAGR) ⓘ | -55.45% | 6.02% |
| EPS Growth (5Y CAGR) ⓘ | N/A | -11.37% |
| BVPS Growth (5Y CAGR) ⓘ | -13.31% | 0.45% |
| Margin Growth (5Y Trend) ⓘ | 95.30% | -0.22% |
| FCF Growth (5Y CAGR) ⓘ | N/A | 5.40% |
| DPS Growth (5Y CAGR) ⓘ | 146.12% | 5.02% |
Quality (Business durability) | ||
| ROIC (Latest) ⓘ | N/A | 5.69% |
| ROE (Latest) ⓘ | 41.00% | 7.56% |
| ROA (Latest) ⓘ | 18.77% | 2.85% |
| ROIC (5Y Median) ⓘ | N/A | 4.22% |
| ROE (5Y Median) ⓘ | 1.18% | 6.03% |
| ROA (5Y Median) ⓘ | 0.49% | 2.44% |
| Net Debt / EBIT (Latest) ⓘ | 0.93 | 7.59 |
| Net Debt / EBIT (5Y Median) ⓘ | 12.64 | 8.40 |
| Net Debt / EBITDA (Latest) ⓘ | 0.88 | 5.27 |
| Net Debt / Assets ⓘ | 23.17% | 37.76% |
| EBITDA / Interest ⓘ | 22.84 | 4.10 |
| Operating Margin (Latest) ⓘ | 391.95% | 35.29% |
| Operating Margin (5Y Median) ⓘ | 7.86% | 37.31% |
| Debt to Equity (Latest) ⓘ | 94.63% | 88.87% |
| Profit Margin (Latest) ⓘ | N/A | 19.61% |
| Free Cash Flow (Latest) ⓘ | -$202.98M | |
Momentum (Price trend) | ||
| 3Y Return ⓘ | +20.32% | +30.75% |
| 12M Return (excl. last month) ⓘ | -8.90% | +4.36% |
| 6M Return ⓘ | -10.09% | -2.52% |
| Price vs. 200-Day MA ⓘ | -7.54% | -2.34% |
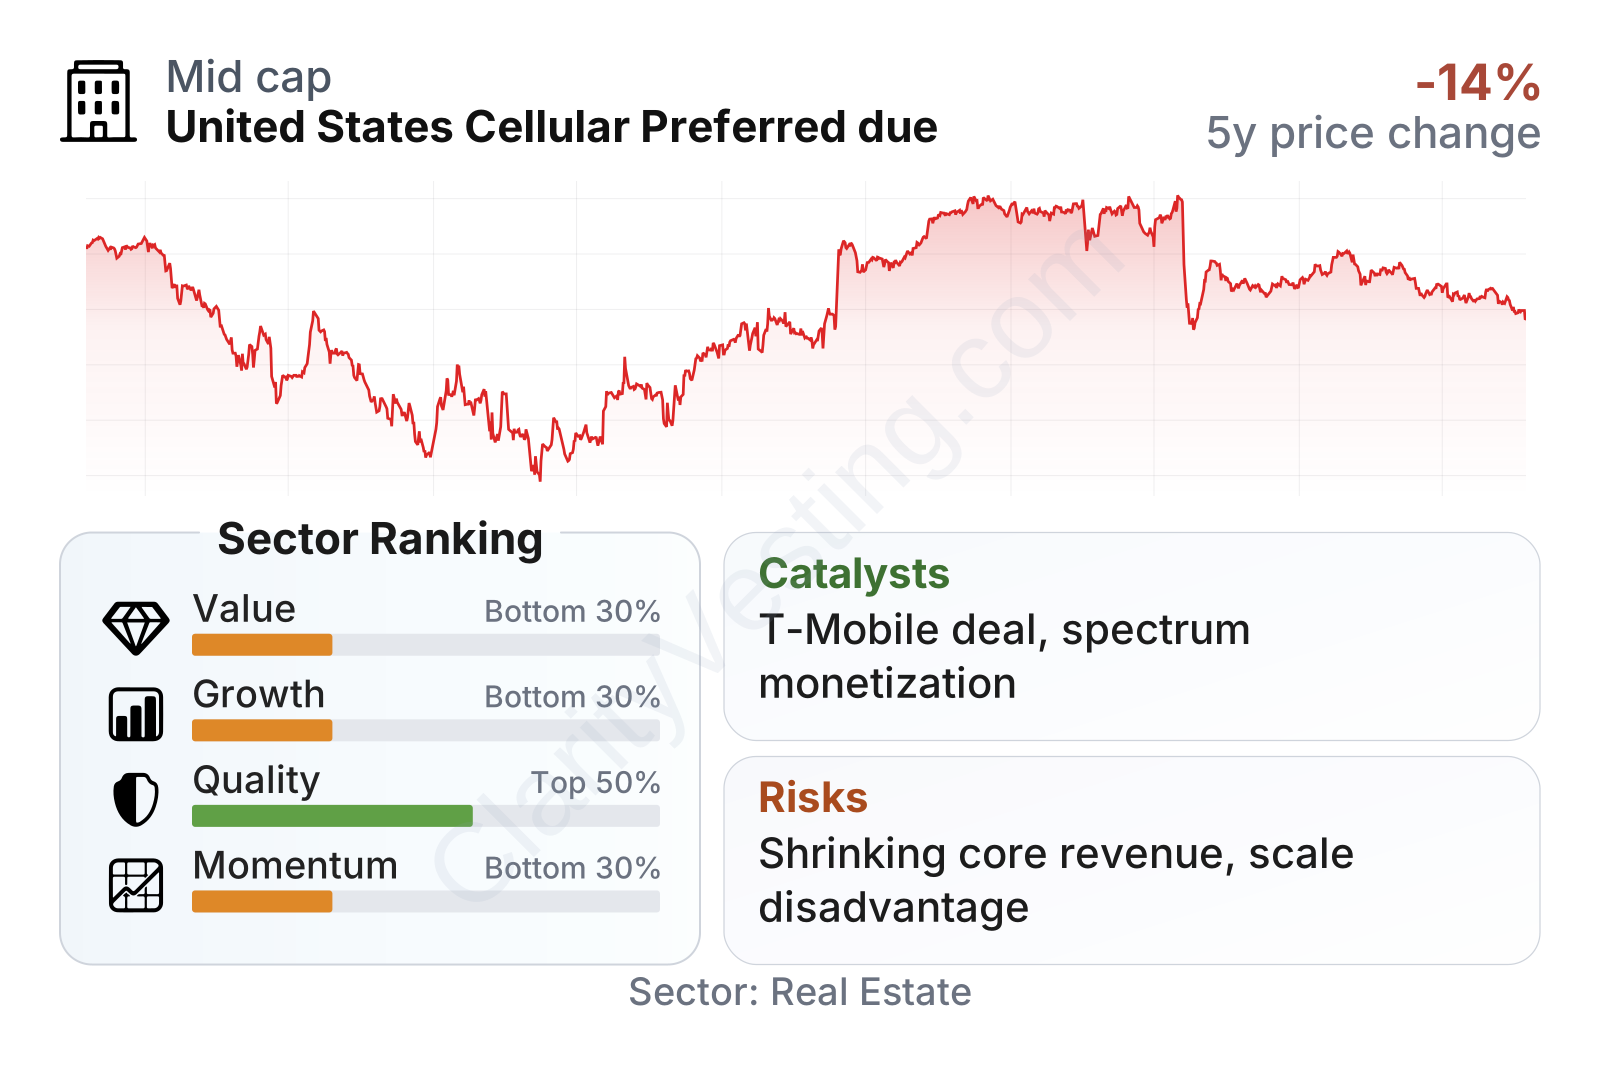
The headline picture is mixed. On one side, balance-sheet pressure looks manageable relative to many companies in the broader property-heavy universe shown in the comparison table: net debt is modest versus earnings, interest coverage is strong, and debt relative to assets is not stretched. On the other side, value and growth rankings sit in the bottom part of the sector comparison, free cash flow is negative, and recent share-price momentum has been soft. The unusually high recent profitability ratios likely reflect one-off accounting or asset-related effects rather than a clean improvement in the recurring earnings power of the business, so they need to be interpreted carefully.
The stock price history also points to a security that has recovered from its 2023 lows but has not built a strong upward trend in 2026. That pattern fits a company in transition rather than one showing clear operating acceleration.
Growth
The wireless industry remains essential, but it is not a fast-growth space in the United States. Demand for mobile service is durable because customers continue to rely on smartphones, data access, and connected devices. However, most growth now comes from network quality, pricing discipline, fixed wireless broadband, enterprise services, and efficient use of spectrum rather than from rapid subscriber expansion alone. That makes scale especially important, and this is where U.S. Cellular faces a structural challenge.
Its strategy has generally made sense for a regional operator: focus on selected markets, invest in network quality where it has local relevance, and monetize assets where possible. The problem is that the largest carriers have broader coverage, larger budgets, stronger device procurement power, and more room to spread network costs across a much bigger subscriber base. As a result, even a sensible strategy can still produce limited growth if the competitive gap is too wide.
A more important catalyst than ordinary operating improvement has been portfolio reshaping. In 2024, United States Cellular announced transactions to sell a large part of its wireless operations and certain spectrum assets, including a major deal with T-Mobile and separate spectrum agreements with other buyers. Those moves could unlock value from assets that the market may not have fully reflected while also changing the company’s future profile in a major way. For a preferred security such as UZE, corporate actions, balance-sheet treatment, and capital allocation after asset sales can matter at least as much as ordinary revenue growth.
The longer revenue trend has not been encouraging. Revenue per share was relatively stable through 2022 and then moved lower, which supports the view that the core business was under pressure before the announced asset sales. The extreme drop shown in 2025 should be treated as a discontinuity caused by business changes or reporting effects, not as a normal operating decline.
The dividend pattern is also unusual. A very large jump in the most recent period does not resemble a regular annual increase from ongoing operations; it more likely reflects a special distribution, capital event, or changed security treatment. That can be positive in the short run, but it is not the same thing as a steadily expanding dividend base supported by recurring earnings.
In short, the sector itself is mature rather than high growth, and the company’s most credible catalyst is corporate restructuring and asset monetization, not rapid expansion in its underlying wireless franchise.
Risks
This article is for informational purposes only and does not constitute financial advice. Some content is AI-generated. See Disclaimer


