Stock Analysis · UNITIL Corporation (UTL)
Overview
UNITIL Corporation is a regulated electric and natural gas utility serving customers in New Hampshire, Massachusetts, and Maine. Its business is straightforward: it delivers electricity and gas to homes and businesses through local utility networks, and it earns most of its return through rates approved by state regulators. That makes UNITIL a relatively small utility by market size, but one with a predictable operating model compared with more cyclical industries.
The company’s revenue comes mainly from utility operations. Based on recent annual reporting, the business mix is approximately:
- Natural gas distribution: about 50% to 55% of revenue. This includes retail delivery and the commodity portion billed to gas customers, mainly in Massachusetts and Maine.
- Electric distribution: about 35% to 40% of revenue. This covers power delivery to retail customers in New Hampshire and Massachusetts, along with recoverable power supply costs.
- Electric transmission and other utility-related revenue: about 10% to 15% of revenue. This includes transmission investments and smaller non-core or service-related items tied to the regulated utility structure.
Because UNITIL operates in regulated markets, revenue is not just driven by customer growth. It also depends on approved rate increases, infrastructure investment added to the regulated asset base, weather patterns, and the pass-through cost of energy supply. Over the last several years, operating income and net income have generally moved upward even when total revenue has fluctuated, which suggests the business has been improving the profitability of its regulated operations rather than relying only on sales growth.
The long-term pattern is notable: total revenue has moved up and down with energy costs, but gross profit, operating income, and net income have trended higher overall. At the same time, interest expense has also risen, reflecting the capital-intensive nature of utility expansion.
Key Figures
| Metric | Value | Sector ⓘ |
|---|---|---|
| Date | Oct 31, 2026 | |
| Context | ||
| Sector | Utilities | |
| Industry | Utilities - Diversified | |
| Market Cap ⓘ | $998.46M | |
| Beta ⓘ | 0.25 | |
Value (Cheapness) | ||
| P/E Ratio ⓘ | 17.27 | 17.37 |
| P/B Ratio ⓘ | 1.52 | 1.55 |
| FCF Yield ⓘ | -4.56% | 0.55% |
| Dividend Yield ⓘ | 3.37% | 3.65% |
| EBIT / EV ⓘ | 6.04% | 4.97% |
| PEG ⓘ | 3.37 | |
Growth (Business expansion) | ||
| Revenue Growth ⓘ | 14.00% | 5.90% |
| RPS Growth (5Y CAGR) ⓘ | -0.26% | 3.69% |
| EPS Growth (5Y CAGR) ⓘ | -4.96% | -10.48% |
| BVPS Growth (5Y CAGR) ⓘ | 4.41% | 4.26% |
| Margin Growth (5Y Trend) ⓘ | 4.59% | 3.59% |
| FCF Growth (5Y CAGR) ⓘ | N/A | -8.84% |
| DPS Growth (5Y CAGR) ⓘ | 2.75% | 4.70% |
Quality (Business durability) | ||
| ROIC (Latest) ⓘ | 5.84% | 6.45% |
| ROA (Latest) ⓘ | 2.72% | 3.17% |
| ROIC (5Y Median) ⓘ | 6.07% | 5.97% |
| ROA (5Y Median) ⓘ | 2.64% | 2.74% |
| Net Debt / EBIT (Latest) ⓘ | 8.02 | 7.22 |
| Net Debt / EBIT (5Y Median) ⓘ | 7.59 | 7.25 |
| Net Debt / EBITDA (Latest) ⓘ | 4.49 | 4.37 |
| Net Debt / Assets ⓘ | 42.63% | 39.16% |
| EBITDA / Interest ⓘ | 4.68 | 4.58 |
| Operating Margin (Latest) ⓘ | 19.80% | 20.63% |
| Operating Margin (5Y Median) ⓘ | 16.75% | 19.99% |
| Debt to Equity (Latest) ⓘ | 148.52% | 138.21% |
| Profit Margin (Latest) ⓘ | 9.49% | 11.32% |
| Free Cash Flow (Latest) ⓘ | -$45.50M | |
Momentum (Price trend) | ||
| 3Y Return ⓘ | +32.33% | +57.19% |
| 12M Return (excl. last month) ⓘ | +11.22% | +6.50% |
| 6M Return ⓘ | +5.21% | -2.89% |
| Price vs. 200-Day MA ⓘ | +5.70% | +0.01% |
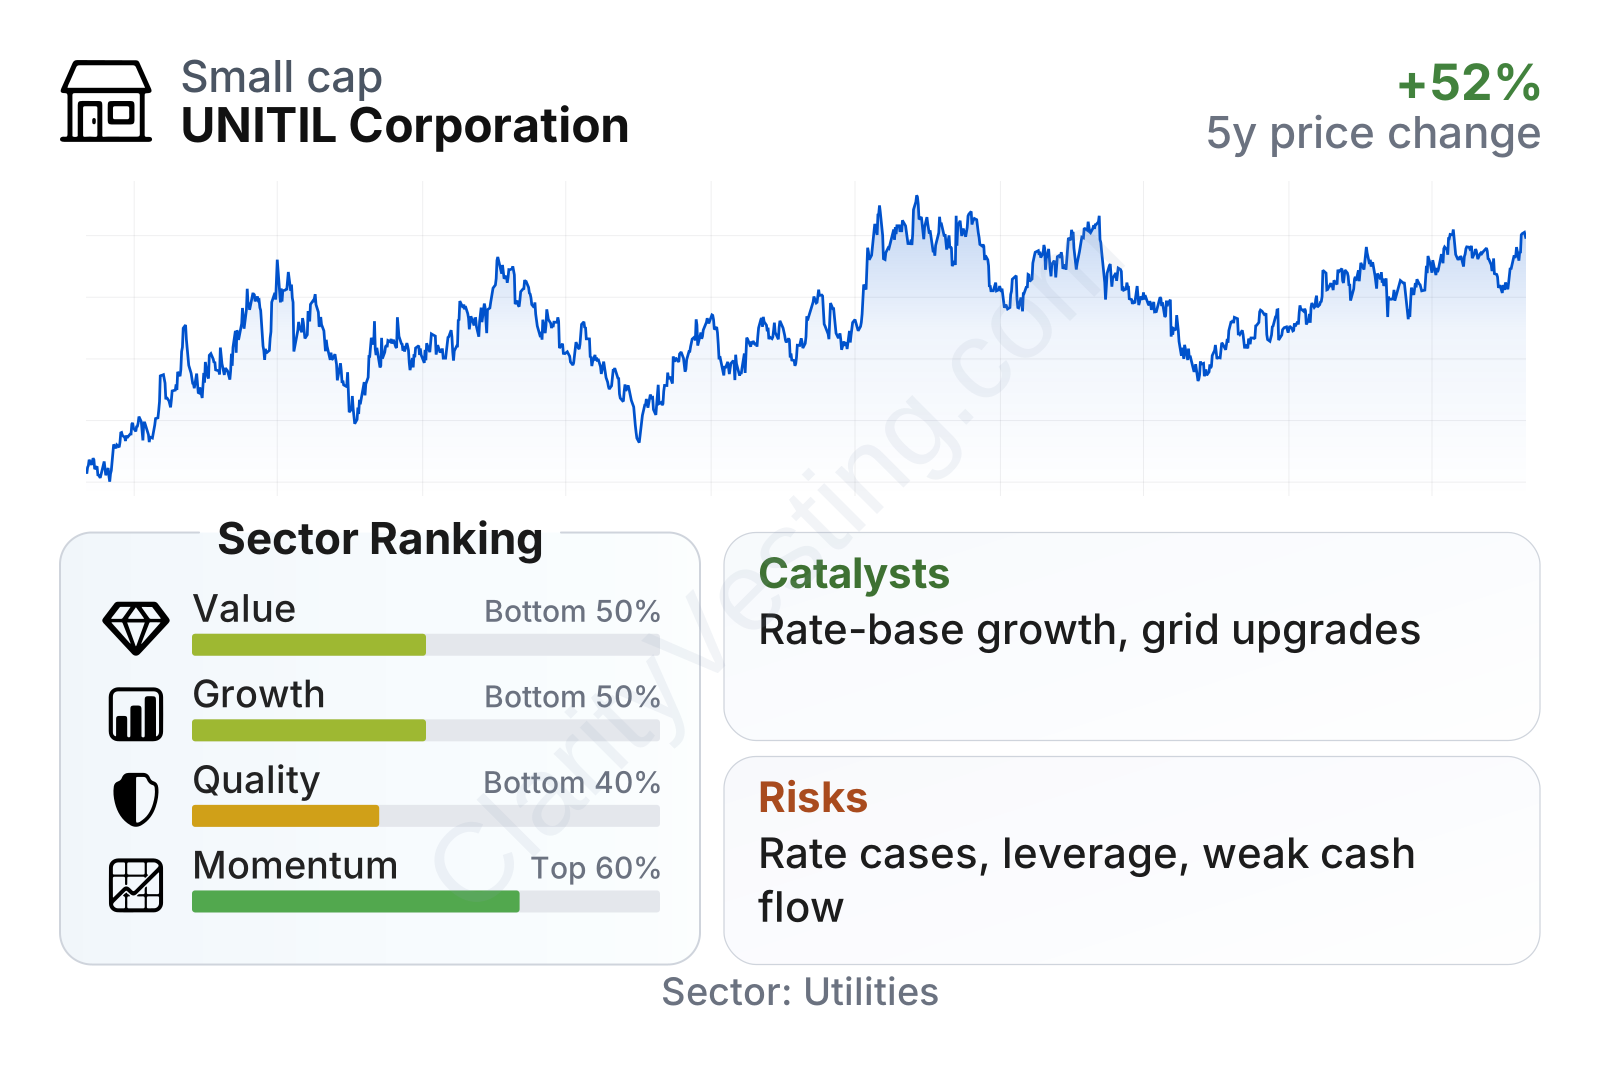
UNITIL sits in the smaller end of the public utility space, with a market value near $1 billion and a very low beta of roughly 0.25, meaning its share price has historically moved much less than the broader market. On valuation, the stock trades close to the sector median on earnings and book value. The more mixed picture appears in business quality and growth metrics: recent revenue growth has been stronger than the utility median, but the longer five-year trend in revenue per share has been flat to slightly negative, and free cash flow remains negative because capital spending is running above internally generated cash.
Profitability is stable but not outstanding for the sector. Returns on assets and invested capital are slightly below typical utility peers, while leverage is a bit above average. Share price performance has been steadier than many sectors but still moderate over a multi-year period, which is consistent with the company’s low-volatility profile.
Growth
UNITIL operates in a sector that is not usually associated with fast expansion, but it does benefit from structural demand for grid resilience, pipeline safety, replacement of aging utility infrastructure, and rate-base growth. In regulated utilities, growth often comes less from volume and more from earning an approved return on new capital investments. That framework can support gradual earnings growth when regulators allow recovery of spending through customer rates.
The company’s strategy fits that model. UNITIL has continued to invest in electric and gas infrastructure, which can expand its regulated asset base over time. It also operates in New England, a region where reliability, storm hardening, and modernization projects remain important. These conditions create a practical path for future growth, even without dramatic customer expansion.
Revenue per share has been uneven rather than steadily rising. The spike in 2022 was followed by a retreat, and the most recent levels are below that peak. That is a reminder that utility revenue can be heavily influenced by commodity pass-through effects and weather, so this measure alone does not fully capture underlying business progress. The more important question is whether regulated investment is supporting earnings and allowed returns over time.
Free cash flow has remained negative, and that is one of the central features of the current growth profile. For a utility, negative free cash flow is not automatically a warning sign because large capital programs often come first, with cost recovery arriving later through approved rates. Still, it does mean growth is being financed partly through debt and external capital rather than through excess internal cash generation.
A visible catalyst is continued utility infrastructure spending tied to system upgrades and transmission-related investment. Another potential support is the ability to seek rate relief as projects enter service. Recent operating trends also point to a business that has been converting investment into higher operating income, even if top-line growth is not smooth from year to year.
Risks
This article is for informational purposes only and does not constitute financial advice. Some content is AI-generated. See Disclaimer


