Stock Analysis · U.S. Physical Therapy Inc (USPH)
Overview
U.S. Physical Therapy Inc. operates outpatient physical therapy clinics and provides industrial injury prevention services for employers. The company grows through a mix of opening clinics, acquiring partner interests in existing locations, and adding workplace health offerings through its industrial services business. Its model is fairly straightforward: patients visit its clinics for rehabilitation and musculoskeletal care, while employer clients use its on-site and prevention programs to reduce workplace injuries and related costs.
The business is organized around two main revenue streams.
- Physical therapy services: about 85% to 90%. This is the core business and includes outpatient rehabilitation delivered through the company’s network of clinics. Revenue comes largely from commercial insurers, Medicare, Medicaid, workers’ compensation programs, and self-pay patients.
- Industrial injury prevention services: about 10% to 15%. This segment includes on-site injury prevention, ergonomics, testing, and related services sold to employers, mainly through the Briotix Health platform.
The company is not a giant healthcare system. It is a specialized operator focused on musculoskeletal care, a category that tends to benefit from aging demographics, demand for conservative treatment before surgery, and employers’ interest in lowering injury-related costs.
Over the last several years, revenue has trended upward from roughly $495 million in 2021 to about $781 million in 2025. Operating income also expanded over that period, although net income has been more uneven because interest expense, taxes, and acquisition-related items have had a meaningful effect below the operating line.
The business has clearly become larger, with revenue and operating profit improving over time. At the same time, the gap between operating income and net income shows that financing costs and other non-operating items matter more than they used to, which is important when judging the company’s earnings quality.
Key Figures
| Metric | Value | Sector ⓘ |
|---|---|---|
| Date | Oct 17, 2026 | |
| Context | ||
| Sector | Healthcare | |
| Industry | Medical Care Facilities | |
| Market Cap ⓘ | $1.27B | |
| Beta ⓘ | 1.11 | |
Value (Cheapness) | ||
| P/E Ratio ⓘ | 471.72 | 24.79 |
| P/B Ratio ⓘ | 9.92 | 3.08 |
| FCF Yield ⓘ | 5.06% | 3.15% |
| Dividend Yield ⓘ | 2.13% | 1.94% |
| EBIT / EV ⓘ | 4.88% | 0.57% |
| PEG ⓘ | 2.73 | |
Growth (Business expansion) | ||
| Revenue Growth ⓘ | 8.50% | 7.45% |
| RPS Growth (5Y CAGR) ⓘ | 7.61% | 8.61% |
| EPS Growth (5Y CAGR) ⓘ | -19.36% | -17.81% |
| BVPS Growth (5Y CAGR) ⓘ | -14.76% | 3.72% |
| Margin Growth (5Y Trend) ⓘ | -3.80% | -0.62% |
| FCF Growth (5Y CAGR) ⓘ | -2.76% | 1.04% |
| DPS Growth (5Y CAGR) ⓘ | 5.51% | 6.77% |
Quality (Business durability) | ||
| ROIC (Latest) ⓘ | 8.75% | 3.24% |
| ROA (Latest) ⓘ | -0.49% | 3.01% |
| ROIC (5Y Median) ⓘ | 10.15% | 4.60% |
| ROA (5Y Median) ⓘ | 2.44% | 1.89% |
| Net Debt / EBIT (Latest) ⓘ | 4.61 | 1.34 |
| Net Debt / EBIT (5Y Median) ⓘ | 3.72 | 1.84 |
| Net Debt / EBITDA (Latest) ⓘ | 3.59 | 1.00 |
| Net Debt / Assets ⓘ | 28.90% | 5.45% |
| EBITDA / Interest ⓘ | 9.35 | 9.64 |
| Operating Margin (Latest) ⓘ | 10.04% | 9.27% |
| Operating Margin (5Y Median) ⓘ | 11.09% | 7.38% |
| Debt to Equity (Latest) ⓘ | 85.99% | 28.58% |
| Profit Margin (Latest) ⓘ | 4.01% | 3.59% |
| Free Cash Flow (Latest) ⓘ | $64.07M | |
Momentum (Price trend) | ||
| 3Y Return ⓘ | +5.12% | +42.80% |
| 12M Return (excl. last month) ⓘ | +5.75% | +18.50% |
| 6M Return ⓘ | +13.64% | +7.57% |
| Price vs. 200-Day MA ⓘ | +13.52% | +5.12% |
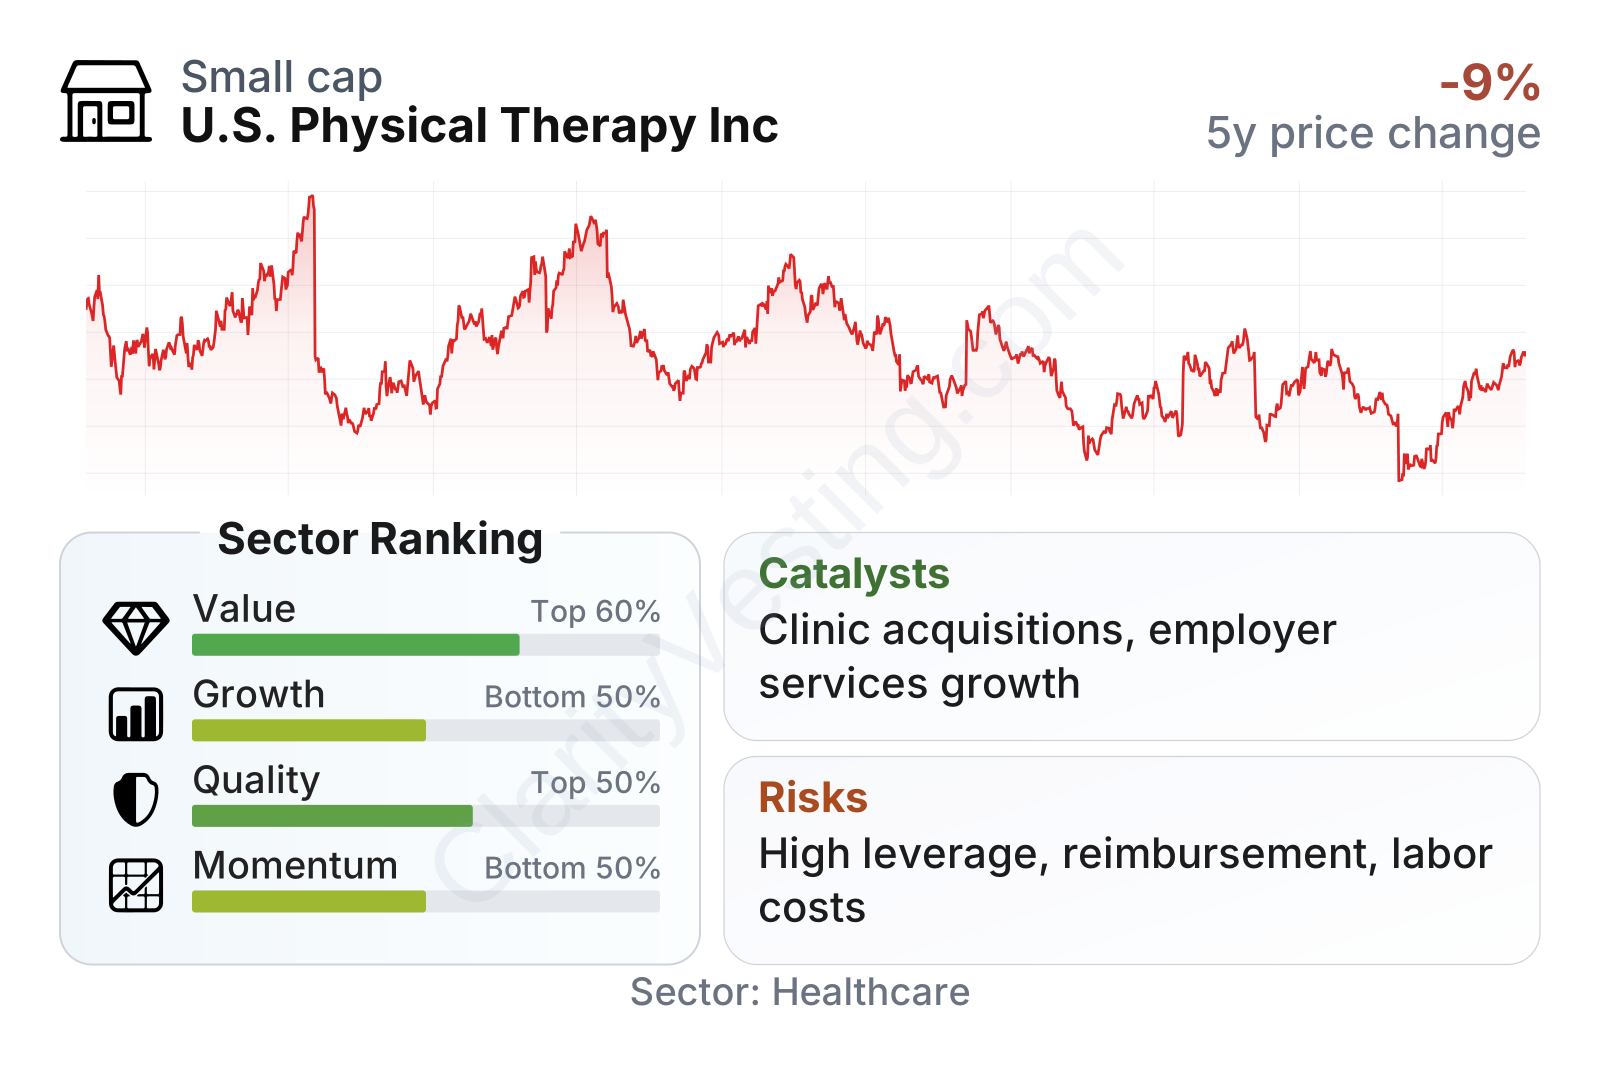
U.S. Physical Therapy sits in the small-cap range, with a market value around $1.3 billion, so it is established but still much smaller than the largest healthcare service companies. The share price has been volatile over the past few years and is well below its 2023 peak, which helps explain why some valuation measures tied to cash flow look more appealing than they once did.
The overall profile is mixed. On valuation, the company looks stronger than many peers on free cash flow yield and EBIT relative to enterprise value, while price-to-book is notably elevated. On quality, operating margins and returns on invested capital are solid for the sector, but leverage is clearly heavier than the industry median. On growth, the most recent annual revenue growth is respectable, yet longer-term earnings and free cash flow trends have been less impressive than revenue growth alone would suggest. Momentum has also lagged the broader healthcare group over longer periods despite a better short-term rebound.
Growth
U.S. Physical Therapy operates in a part of healthcare with favorable long-term demand drivers. Physical therapy and related musculoskeletal care benefit from an aging population, rising rates of chronic pain and mobility issues, and a broader push toward non-surgical, lower-cost treatment pathways. Employers also have a reason to keep spending on injury prevention because reducing lost-time incidents can lower insurance and productivity costs.
The company’s strategy is logical for this industry. It combines local clinic partnerships with acquisitions and supplemental employer-focused services. That approach can work well because rehabilitation is still a fragmented market, giving established operators room to add locations and gain density without needing breakthrough technology. The industrial services business also broadens the model beyond reimbursement-based clinic visits and adds another channel for client relationships.
Revenue growth has not been perfectly smooth, but the recent pattern shows a meaningful rebound after a soft stretch in 2025. The latest year-over-year growth rate is above the sector median, and recent quarterly trends indicate the business has regained momentum. That is encouraging because it suggests the company is still finding ways to expand despite reimbursement pressure and labor constraints that affect the entire therapy industry.
Cash generation has held up better than earnings volatility might suggest. Free cash flow has remained in a healthy range and recently moved back toward the upper end of its recent history. For a clinic-based healthcare company, that matters because it supports acquisitions, debt service, and dividends without relying entirely on outside financing.
A meaningful catalyst is continued consolidation in outpatient therapy. Smaller independent clinic owners often lack the scale to manage payer contracting, staffing, compliance, and technology investments. U.S. Physical Therapy has experience partnering with local operators rather than fully centralizing everything, which can make it an attractive acquirer in a fragmented field. Another catalyst is further expansion of employer services, where prevention-oriented spending can remain attractive even when consumers become more cautious.
Recent corporate updates have also pointed to ongoing clinic expansion, acquisitions, and continued development of the industrial injury prevention platform. None of that guarantees rapid earnings growth, but it does reinforce that management is still executing a consistent expansion plan rather than depending on a single one-time event.
Risks
This article is for informational purposes only and does not constitute financial advice. Some content is AI-generated. See Disclaimer


