Stock Analysis · U.S. Bancorp (USB)
Overview
U.S. Bancorp is one of the largest banking groups in the United States. Through U.S. Bank and related businesses, it provides everyday banking services such as deposits, loans, payments, credit cards, wealth management, trust services, and capital markets products. Its customer base spans consumers, small businesses, commercial clients, corporate customers, institutions, and government entities. In simple terms, it is a diversified bank that earns money both from lending and from fees tied to financial services.
The company’s revenue mix is broader than that of many regional banks because it has a meaningful payments and fee-based business alongside traditional lending. Based on recent annual reporting, its main revenue sources can be summarized as follows:
- Net interest income: about 48% to 52% of total revenue. This is the spread between what the bank earns on loans and securities and what it pays on deposits and other funding.
- Payment services: about 20% to 24%. This includes merchant processing, card-related fees, corporate payment products, and treasury-related payment activity.
- Wealth management and investment services: about 11% to 14%. This covers trust, custody, fund services, brokerage, and advisory income.
- Mortgage banking: about 3% to 6%. This includes mortgage servicing and mortgage production-related fees.
- Service charges and deposit-related fees: about 4% to 6%. These are account and transaction fees connected to retail and business banking.
- Capital markets and other fee income: about 8% to 12%. This includes investment banking, loan syndication, trading-related activity, and various corporate banking fees.
This mix matters because it gives U.S. Bancorp more balance than a bank that relies mostly on loan growth. In recent years, total revenue rose meaningfully, but earnings moved around more than revenue because funding costs and credit conditions changed. The business remains centered on mainstream banking, but its payments and wealth operations make it less one-dimensional than many peers.
The revenue base has expanded over the last several years, while profitability has been more cyclical. Interest expense rose sharply during the higher-rate period, which weighed on earnings even as total revenue stayed strong. More recently, net income has improved again, showing that the franchise still converts a large portion of revenue into profit once funding pressure eases.
Key Figures
| Metric | Value | Sector ⓘ |
|---|---|---|
| Date | Oct 19, 2026 | |
| Context | ||
| Sector | Financial Services | |
| Industry | Banks - Regional | |
| Market Cap ⓘ | $91.50B | |
| Beta ⓘ | 1.02 | |
Value (Cheapness) | ||
| P/E Ratio ⓘ | 11.43 | 12.26 |
| P/B Ratio ⓘ | 1.38 | 1.23 |
| FCF Yield ⓘ | 13.53% | 10.40% |
| Dividend Yield ⓘ | 3.66% | 3.02% |
| EBIT / EV ⓘ | 8.21% | 8.14% |
| PEG ⓘ | 1.79 | |
Growth (Business expansion) | ||
| Revenue Growth ⓘ | 8.40% | 9.25% |
| RPS Growth (5Y CAGR) ⓘ | 14.70% | 12.19% |
| EPS Growth (5Y CAGR) ⓘ | 1.13% | -9.36% |
| BVPS Growth (5Y CAGR) ⓘ | 6.56% | 4.99% |
| Margin Growth (5Y Trend) ⓘ | -20.66% | -3.86% |
| FCF Growth (5Y CAGR) ⓘ | -5.21% | 4.81% |
| DPS Growth (5Y CAGR) ⓘ | 3.82% | 8.79% |
Quality (Business durability) | ||
| ROIC (Latest) ⓘ | 5.89% | 9.49% |
| ROE (Latest) ⓘ | 12.64% | 13.87% |
| ROA (Latest) ⓘ | 1.20% | 1.54% |
| ROIC (5Y Median) ⓘ | 5.63% | 7.86% |
| ROE (5Y Median) ⓘ | 11.18% | 12.17% |
| ROA (5Y Median) ⓘ | 0.94% | 1.30% |
| Net Debt / EBIT (Latest) ⓘ | 2.89 | 0.99 |
| Net Debt / EBIT (5Y Median) ⓘ | 2.15 | 0.73 |
| Net Debt / EBITDA (Latest) ⓘ | 1.63 | 0.91 |
| Operating Margin (Latest) ⓘ | 23.33% | 22.30% |
| Operating Margin (5Y Median) ⓘ | 22.20% | 24.63% |
| Debt to Equity (Latest) ⓘ | 109.96% | 58.04% |
| Profit Margin (Latest) ⓘ | 30.01% | 26.57% |
| Free Cash Flow (Latest) ⓘ | $12.38B | |
Momentum (Price trend) | ||
| 3Y Return ⓘ | +91.26% | +88.26% |
| 12M Return (excl. last month) ⓘ | +28.35% | +19.24% |
| 6M Return ⓘ | +7.76% | +4.70% |
| Price vs. 200-Day MA ⓘ | +3.31% | +3.66% |
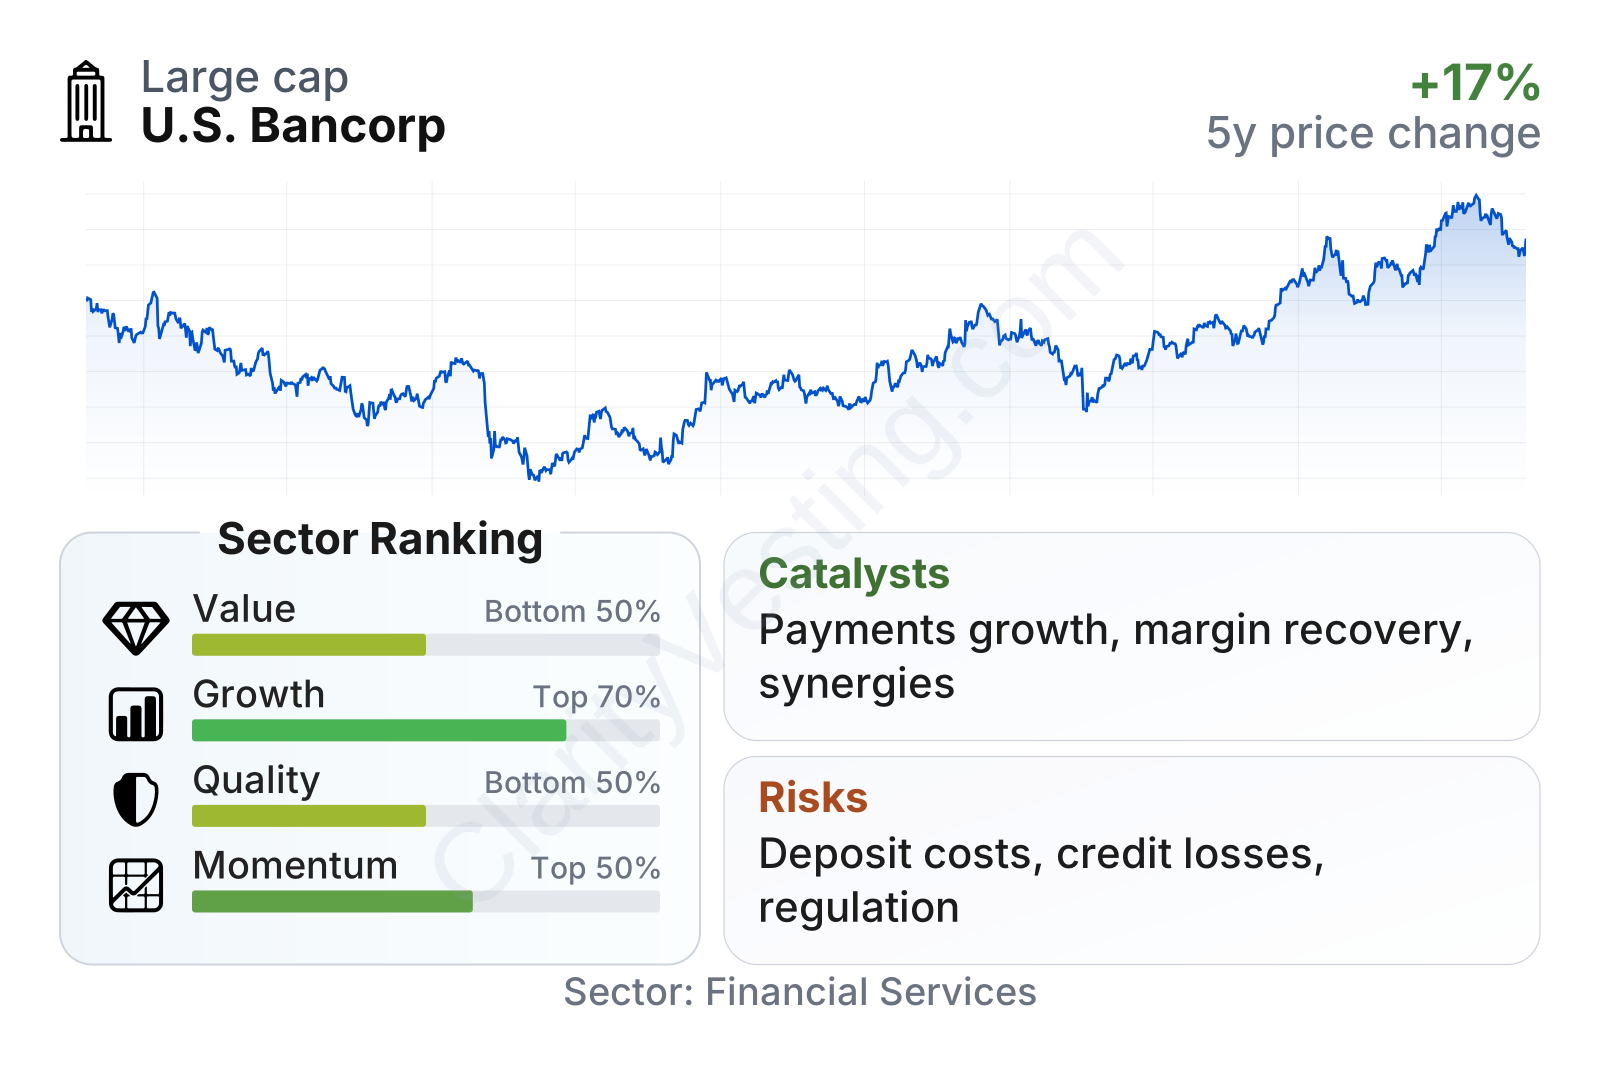
U.S. Bancorp stands out as a very large regional bank with market behavior close to the broader market, reflected in a beta near 1. Valuation metrics are mixed rather than clearly cheap: earnings and cash-flow measures look broadly in line with or slightly better than sector norms, while price-to-book sits a bit above the sector median. Growth indicators are respectable over a multi-year period, especially on revenue per share and book value per share, but quality measures are less impressive because returns on assets and capital trail many peers. Momentum has been solid, with share-price performance over the last year and over three years running slightly ahead of the sector median.
Growth
U.S. Bancorp operates in a sector that is mature, but still capable of steady expansion through payments, digital banking, commercial lending, treasury services, and wealth management. Traditional branch banking by itself is not a high-growth market, yet payment processing, embedded treasury tools, and fee-based advisory services remain attractive areas. That is important because banks with several income streams usually have more ways to grow than banks that depend mainly on balance-sheet expansion.
The company’s strategy appears coherent for long-term development. Management has emphasized a mix of disciplined lending, deposit gathering, payments, and operating efficiency. This approach does not promise explosive growth, but it fits a business built around scale, relationships, and risk control. U.S. Bancorp also gained additional scale and customer relationships from the MUFG Union Bank acquisition, which expanded its presence in key western U.S. markets and added room for cost synergies and cross-selling.
Earnings per share fell after the 2021 peak as interest costs and integration pressure reduced profitability, but the more recent direction is better. That pattern suggests the bank is moving through a normalization phase rather than facing a broken business model. For a bank, a recovery in earnings after a difficult rate and funding period can matter more than a single weak year.
Book value per share has moved steadily higher over the last five years, which is a constructive sign for a bank. In plain language, the company has continued building its underlying equity base even through a difficult operating period. That can support future lending capacity, dividend resilience, and earnings power if returns improve.
Several visible catalysts support the medium-term outlook. If interest rates stabilize or decline gradually, deposit competition could ease and funding costs may become less of a drag. The payments business remains a structural growth engine as card spending, merchant acceptance, and corporate payment flows keep moving toward digital channels. Continued integration benefits from past acquisitions and ongoing efficiency programs could also help margins over time. In 2026, company updates have continued to highlight capital strength, loan and deposit discipline, and expense management, all of which are relevant for restoring stronger profitability.
Risks
This article is for informational purposes only and does not constitute financial advice. Some content is AI-generated. See Disclaimer


