Stock Analysis · UOL Group Limited (UOLGF)
Overview
UOL Group Limited is a Singapore-based real estate company with three main pillars: property development, property investment, and hospitality. In simple terms, it builds and sells homes, owns commercial and retail properties that generate recurring rent, and operates hotels and serviced suites through brands such as Pan Pacific and PARKROYAL. The group is concentrated in Singapore but also has exposure to other markets in Asia and selected international locations through its hotel business and investments.
This mix matters because it gives UOL two different earnings engines. Development can produce larger but more cyclical profits when projects are completed and sold, while rental income and hotel operations provide more recurring cash flow, although hotels are also sensitive to travel demand and economic conditions.
Based on recent annual reporting, revenue appears to come primarily from the following sources:
- Property development: about 45% to 55% of revenue in a typical recent year. This includes residential project sales, mainly in Singapore, recognized as projects progress or are completed.
- Hotel operations: about 25% to 35%. This covers room revenue, food and beverage, and related hospitality income from owned or managed hotels and serviced residences.
- Property investments: about 10% to 20%. This includes rental income from offices, retail assets, and other investment properties.
- Other income streams: usually below 10%. These can include management services, investments, and smaller ancillary activities depending on the year.
Over the last several years, total revenue has moved in a fairly wide range, which is normal for developers because project timing can shift reported sales from one year to another. Even so, the overall business has remained sizable, and gross profit has held up relatively well. One positive sign is that revenue and operating profit in 2025 recovered from the softer 2024 level, showing that the group still has meaningful earnings power when project contributions and hotel performance improve.
The business mix shows a company that is not reliant on a single activity. Development remains the main profit driver, but recurring rent and hospitality income help soften the volatility that usually comes with residential project cycles.
Key Figures
| Metric | Value | Sector ⓘ |
|---|---|---|
| Date | Oct 17, 2026 | |
| Context | ||
| Sector | Real Estate | |
| Industry | Real Estate - Development | |
| Market Cap ⓘ | $5.61B | |
| Beta ⓘ | 0.64 | |
Value (Cheapness) | ||
| P/E Ratio ⓘ | 13.50 | 17.38 |
| P/B Ratio ⓘ | 0.76 | 0.85 |
| FCF Yield ⓘ | 33.39% | 7.38% |
| Dividend Yield ⓘ | 2.72% | 4.85% |
| EBIT / EV ⓘ | N/A | 3.78% |
| PEG ⓘ | 2.38 | |
Growth (Business expansion) | ||
| Revenue Growth ⓘ | -7.40% | 5.30% |
| RPS Growth (5Y CAGR) ⓘ | 6.56% | 6.02% |
| EPS Growth (5Y CAGR) ⓘ | -51.80% | -11.37% |
| BVPS Growth (5Y CAGR) ⓘ | -9.34% | 0.45% |
| Margin Growth (5Y Trend) ⓘ | 3.20% | -0.22% |
| FCF Growth (5Y CAGR) ⓘ | 22.03% | 5.40% |
| DPS Growth (5Y CAGR) ⓘ | 4.64% | 5.02% |
Quality (Business durability) | ||
| ROIC (Latest) ⓘ | 8.41% | 5.69% |
| ROE (Latest) ⓘ | 13.73% | 7.56% |
| ROA (Latest) ⓘ | 4.17% | 2.85% |
| ROIC (5Y Median) ⓘ | 3.97% | 4.22% |
| ROE (5Y Median) ⓘ | 6.09% | 6.03% |
| ROA (5Y Median) ⓘ | 2.13% | 2.44% |
| Net Debt / EBIT (Latest) ⓘ | 2.64 | 7.59 |
| Net Debt / EBIT (5Y Median) ⓘ | 5.17 | 8.40 |
| Net Debt / EBITDA (Latest) ⓘ | 2.44 | 5.27 |
| Net Debt / Assets ⓘ | 18.80% | 37.76% |
| EBITDA / Interest ⓘ | 4.93 | 4.10 |
| Operating Margin (Latest) ⓘ | 26.80% | 35.29% |
| Operating Margin (5Y Median) ⓘ | 29.17% | 37.31% |
| Debt to Equity (Latest) ⓘ | 45.86% | 88.87% |
| Profit Margin (Latest) ⓘ | 16.93% | 19.61% |
| Free Cash Flow (Latest) ⓘ | $1.87B | |
Momentum (Price trend) | ||
| 3Y Return ⓘ | +50.64% | +30.75% |
| 12M Return (excl. last month) ⓘ | +43.58% | +4.36% |
| 6M Return ⓘ | -21.25% | -2.52% |
| Price vs. 200-Day MA ⓘ | +6.15% | -2.34% |
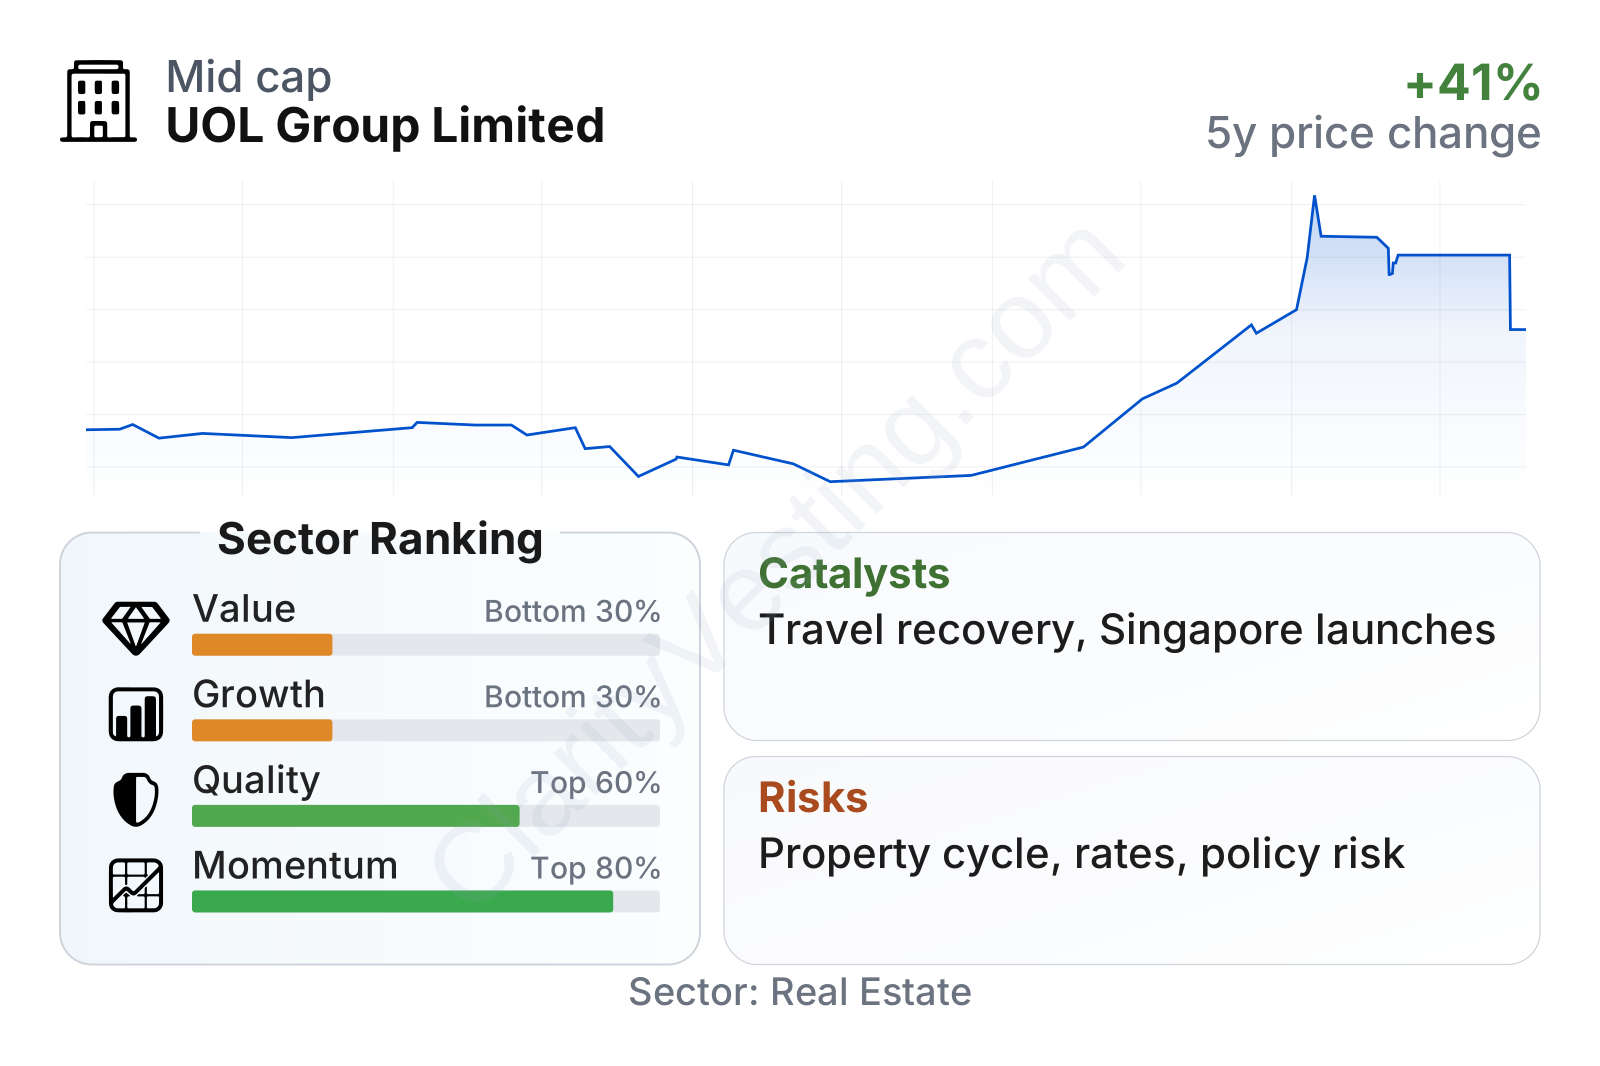
UOL is a mid-sized real estate group with a relatively low share-price volatility profile, as shown by its beta below 1. On valuation, the stock screens cheaper than the sector on both earnings and book value, but the overall value score is held back by a growth profile that is weaker than many peers and a dividend yield that is modest for real estate.
Quality is the stronger part of the picture. Recent returns on equity, assets, and invested capital are above sector medians, while leverage looks more conservative than many peers. Debt to equity is below 50%, net debt relative to earnings is clearly below sector norms, and interest coverage is somewhat better than the median, which points to a balance sheet that appears manageable for a property group.
Growth is the weakest area in the current snapshot. Recent year-over-year revenue declined, earnings over five years have been uneven, and book value per share has trended down. At the same time, free cash flow has improved strongly over a longer period, and price momentum over three years and over the last year excluding the most recent month has been better than much of the sector, even after a weaker last six months.
Growth
UOL operates in sectors with different long-term characteristics. Singapore residential development is mature and cyclical, not a high-growth industry in the way software or semiconductors can be, but it can still offer attractive economics when land is bought well, demand remains healthy, and supply is disciplined. Hospitality has more structural growth support from the recovery and expansion of regional travel, business events, and premium tourism. Rental property adds stability rather than fast expansion.
The group’s strategy makes sense for long-term resilience. A developer with recurring rent and hotel cash flow is generally better positioned than a pure-play builder because it is less exposed to one single cycle. UOL’s portfolio also gives it optionality: it can benefit from housing demand in Singapore, improving room rates and occupancy in hospitality, and steady income from investment properties.
Revenue per share has generally trended upward over the past five years despite year-to-year fluctuations. That pattern suggests the company has been able to expand the business over time without relying on heavy dilution. For a property company, that is a useful sign because share issuance can sometimes weaken per-share results.
A potentially important catalyst is the continued normalization of travel and hotel demand in Asia-Pacific. UOL’s hotel platform gives it direct exposure to room-rate recovery and higher occupancy. Another support is Singapore’s status as a relatively supply-constrained and financially strong property market. Well-located projects and prime commercial assets can retain pricing power better than lower-quality portfolios in weaker markets.
Recent company reporting has also pointed to active project launches, landbank replenishment, and ongoing portfolio management. Those are important because future growth for a developer depends on having projects to sell several years ahead, not just on current earnings. In addition, stronger free cash flow in recent years gives the group more flexibility to fund development, maintain properties, or support distributions.
Dividend per share has been fairly steady with a mild upward trend over five years, although it is not a high-yield profile. That stability may matter more than headline yield because it suggests management has not been forced into abrupt dividend reductions across the whole period, despite swings in development profits and interest costs.
Risks
This article is for informational purposes only and does not constitute financial advice. Some content is AI-generated. See Disclaimer


