Stock Analysis · United Energy Group Limited (UNEGF)
Overview
United Energy Group Limited is an upstream energy company focused mainly on oil and natural gas exploration, development, and production. In simple terms, it looks for hydrocarbon resources, develops fields, and sells the oil and gas it produces. The company has built its portfolio around assets in the Middle East, especially Iraq, while also having exposure to other producing regions through its broader asset base and trading-related activities described in its public reports.
For long-term analysis, the key point is that United Energy Group is not a diversified integrated major. It is more concentrated in production assets and therefore more directly exposed to crude oil prices, field performance, reserve replacement, and country-specific operating conditions. That can create strong earnings when production and prices are favorable, but it also makes results more volatile than those of larger global energy groups.
The company’s revenue mix is driven primarily by crude oil sales, with a smaller contribution from natural gas and other energy-related activities. Based on public disclosures and the structure of reported results, the main sources of revenue appear to be:
- Crude oil sales: approximately 85% to 95% of revenue. This is the core business and includes production from operated or participating upstream oil assets.
- Natural gas sales and related hydrocarbons: approximately 5% to 15% of revenue. This includes gas production and, where relevant, associated condensate or similar output.
- Other energy-related income: a limited share of revenue, likely below 5% in most periods. This can include service, trading, or other miscellaneous operating items depending on the reporting year.
The broader financial flow shows a business that has expanded revenue sharply over the last several years, but with gross profit not keeping pace at the same rate. That pattern suggests rising throughput and activity, yet also pressure from costs, product mix, or pricing dynamics. Operating profit recovered after a very weak 2023, but net income remains more uneven than revenue growth alone would suggest.
Key Figures
| Metric | Value | Sector ⓘ |
|---|---|---|
| Date | Oct 17, 2026 | |
| Context | ||
| Sector | Energy | |
| Industry | Oil & Gas E&P | |
| Market Cap ⓘ | $1.36B | |
| Beta ⓘ | -0.05 | |
Value (Cheapness) | ||
| P/E Ratio ⓘ | 5.30 | 15.44 |
| P/B Ratio ⓘ | 0.10 | 1.73 |
| FCF Yield ⓘ | 61.93% | 8.20% |
| Dividend Yield ⓘ | N/A | 3.59% |
| EBIT / EV ⓘ | N/A | 7.46% |
| PEG ⓘ | N/A | |
Growth (Business expansion) | ||
| Revenue Growth ⓘ | 33.70% | 26.90% |
| RPS Growth (5Y CAGR) ⓘ | 27.38% | 6.90% |
| EPS Growth (5Y CAGR) ⓘ | -12.48% | -15.73% |
| BVPS Growth (5Y CAGR) ⓘ | -1.42% | 6.07% |
| Margin Growth (5Y Trend) ⓘ | -25.18% | 0.58% |
| FCF Growth (5Y CAGR) ⓘ | -10.62% | 1.86% |
| DPS Growth (5Y CAGR) ⓘ | 20.75% | 16.79% |
Quality (Business durability) | ||
| ROIC (Latest) ⓘ | N/A | 11.40% |
| ROA (Latest) ⓘ | 9.38% | 6.06% |
| ROIC (5Y Median) ⓘ | 12.16% | 10.30% |
| ROA (5Y Median) ⓘ | 6.00% | 5.42% |
| Net Debt / EBIT (Latest) ⓘ | 0.05 | 1.64 |
| Net Debt / EBIT (5Y Median) ⓘ | 0.11 | 1.83 |
| Net Debt / EBITDA (Latest) ⓘ | 0.02 | 1.08 |
| Net Debt / Assets ⓘ | 0.78% | 17.29% |
| EBITDA / Interest ⓘ | 19.30 | 9.64 |
| Operating Margin (Latest) ⓘ | 12.03% | 16.27% |
| Operating Margin (5Y Median) ⓘ | 11.13% | 20.39% |
| Debt to Equity (Latest) ⓘ | 25.51% | 54.76% |
| Profit Margin (Latest) ⓘ | 6.06% | 8.82% |
| Free Cash Flow (Latest) ⓘ | $844.30M | |
Momentum (Price trend) | ||
| 3Y Return ⓘ | -48.14% | +67.38% |
| 12M Return (excl. last month) ⓘ | +27.91% | +49.19% |
| 6M Return ⓘ | -18.46% | +7.07% |
| Price vs. 200-Day MA ⓘ | -17.48% | +9.56% |
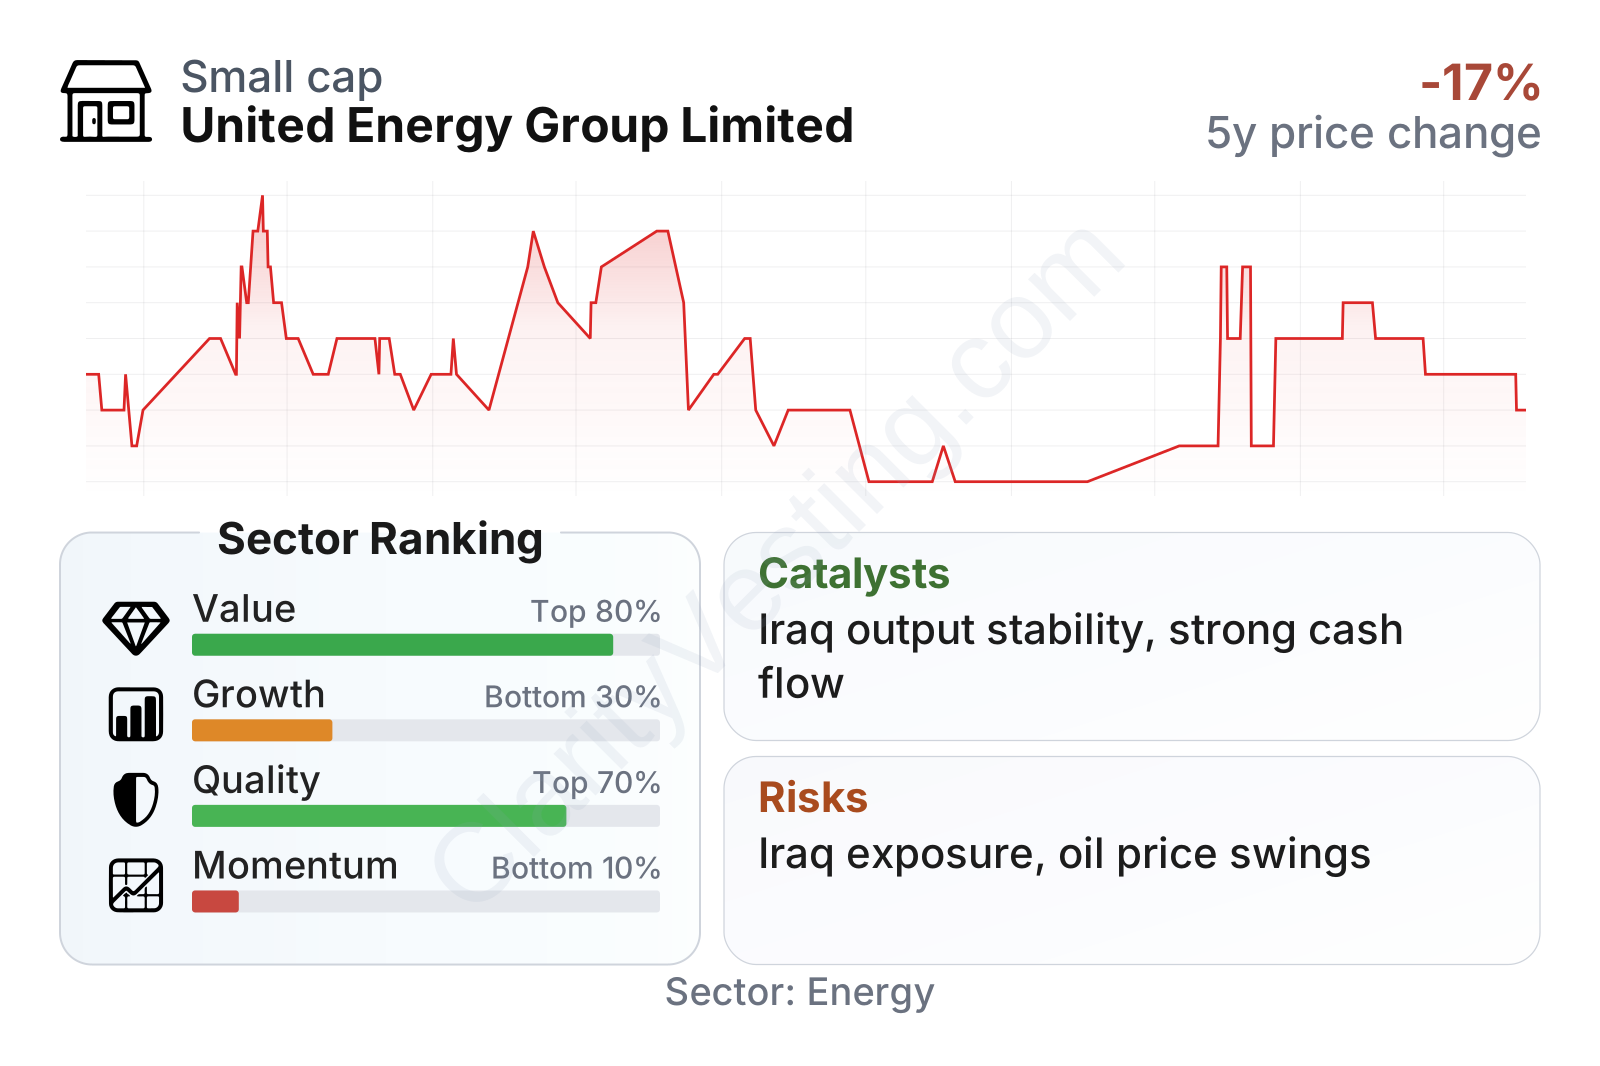
The overall profile is unusual. On valuation measures, the stock screens as very inexpensive versus much of the energy sector, with a low earnings multiple, a very low price-to-book ratio, and an exceptionally high free cash flow yield. Balance-sheet strength is also notable: leverage is very low, net debt is close to negligible relative to earnings, and interest coverage is solid.
At the same time, the table also points to weaker areas. Profitability is acceptable but not elite for the sector, with margins below median. Growth has been mixed: revenue expansion has been strong over one and five years, but earnings, free cash flow trend, and book value growth have been less consistent. Market performance has also been weak, with the share price trailing the sector over most recent periods despite a temporary rebound earlier in 2026.
The stock-price history reflects that tension. The shares have traded in a relatively low range for several years, with brief recoveries followed by pullbacks. That usually signals that the market recognizes the company’s cash generation and low valuation, but remains cautious about durability, governance, asset concentration, or country risk.
Growth
United Energy Group operates in a sector that should remain economically relevant for many years, even as the global energy system gradually changes. Oil and gas demand growth is no longer a simple straight line everywhere, but upstream supply still needs continuous investment because existing fields naturally decline over time. Companies that can maintain production from established fields, add reserves efficiently, and operate at low cost can still create meaningful long-term value.
The company’s strategy broadly makes industrial sense. It is centered on producing assets in regions where large resource bases can support long-life output. That can be attractive because successful fields often produce for many years and can generate large amounts of cash once infrastructure is in place. The strong revenue growth over the past five years also indicates that the company has been able to scale its business materially.
A major catalyst is the combination of low leverage and high cash generation. With debt levels well below sector norms, the company has more room than many peers to absorb commodity volatility, fund field development, or continue shareholder distributions if operating conditions stay supportive. Its dividend growth over five years also indicates that management has been willing to return part of that cash flow.
Another potential growth driver is any increase in production capacity or export reliability from its core operating regions, especially Iraq. In upstream energy, even modest gains in production volumes can have an outsized effect on earnings when fixed infrastructure is already in place. If operating stability improves and realized pricing remains healthy, the company’s earnings power could look stronger than recent market performance suggests.
Recent public company communications have also emphasized ongoing operational development and reserve support across its asset base. For a company like United Energy Group, the most important practical indicators are production continuity, field development progress, reserve replacement, and the ability to convert accounting profit into actual free cash flow. On that front, the latest profile remains supportive, even if not perfectly smooth year to year.
Risks
This article is for informational purposes only and does not constitute financial advice. Some content is AI-generated. See Disclaimer


