Stock Analysis · WFD Unibail Rodamco NV (UNBLF)
Overview
WFD Unibail Rodamco NV, part of the Unibail-Rodamco-Westfield group, is a large European commercial real estate company focused mainly on flagship shopping centers in major cities and dense catchment areas. It owns, operates, and develops retail-led destinations that combine stores, restaurants, leisure, and services. The group also has a smaller exposure to offices and convention or exhibition venues, but retail real estate is the core of the business.
The company’s revenue comes primarily from rental income and related property activities. Based on recent annual reporting structure, the business mix is approximately the following:
- Shopping center rental and service income: roughly 75% to 85% of revenue. This includes rent paid by retailers, variable rent components, parking, and service charges linked to flagship malls.
- Offices and other property income: roughly 5% to 10%. This covers office leasing and smaller non-retail assets.
- Convention, exhibition, and event activities: roughly 10% to 15%. This includes venue-related income, services, and recurring event activity where the group still has exposure.
The business model is straightforward: own high-traffic real estate, lease space to tenants, maintain occupancy, and raise rental income through asset quality, location, and redevelopment. The concentration on premium assets matters because top-tier malls have generally been more resilient than weaker retail centers, especially as brands seek fewer but more productive physical locations.
The earnings profile has also improved markedly since the post-pandemic recovery period. Revenue has risen from a little above $2.1 billion in 2021 to around $3.4 billion to $3.6 billion in the most recent years, while operating profitability has rebounded sharply after a difficult 2023. Interest expense remains a major cost, which is normal for a property company, but the recent pattern shows a business that has moved back into stronger cash generation.
The visual flow highlights a company that has become much more efficient at converting revenue into operating profit than it was a few years ago. The main point to watch is not property-level profitability, which looks strong, but the drag from financing costs and periodic valuation effects that can make net income volatile from one year to the next.
Key Figures
| Metric | Value | Sector ⓘ |
|---|---|---|
| Date | Nov 21, 2026 | |
| Context | ||
| Sector | Real Estate | |
| Industry | REIT - Retail | |
| Market Cap ⓘ | $14.53B | |
| Beta ⓘ | 1.38 | |
Value (Cheapness) | ||
| P/E Ratio ⓘ | 7.98 | 17.59 |
| P/B Ratio ⓘ | N/A | 1.58 |
| FCF Yield ⓘ | 20.34% | 5.76% |
| Dividend Yield ⓘ | 4.46% | 4.81% |
| EBIT / EV ⓘ | 14.44% | 4.97% |
| PEG ⓘ | 1.85 | |
Growth (Business expansion) | ||
| Revenue Growth ⓘ | -0.40% | 5.70% |
| RPS Growth (5Y CAGR) ⓘ | 10.56% | 5.96% |
| EPS Growth (5Y CAGR) ⓘ | -3.35% | -3.46% |
| BVPS Growth (5Y CAGR) ⓘ | -8.86% | 0.32% |
| Margin Growth (5Y Trend) ⓘ | 54.77% | -0.65% |
| FCF Growth (5Y CAGR) ⓘ | 8.48% | 5.08% |
| DPS Growth (5Y CAGR) ⓘ | 77.48% | 5.00% |
Quality (Business durability) | ||
| ROIC (Latest) ⓘ | 9.42% | 5.13% |
| ROE (Latest) ⓘ | 16.73% | 7.64% |
| ROA (Latest) ⓘ | 4.52% | 3.05% |
| ROIC (5Y Median) ⓘ | 1.96% | 4.20% |
| ROE (5Y Median) ⓘ | 1.04% | 6.03% |
| ROA (5Y Median) ⓘ | 0.27% | 2.41% |
| Net Debt / EBIT (Latest) ⓘ | 4.32 | 7.59 |
| Net Debt / EBIT (5Y Median) ⓘ | 18.20 | 8.34 |
| Net Debt / EBITDA (Latest) ⓘ | 4.19 | 5.43 |
| Net Debt / Assets ⓘ | 41.62% | 38.21% |
| EBITDA / Interest ⓘ | 2.36 | 4.20 |
| Operating Margin (Latest) ⓘ | 73.63% | 34.59% |
| Operating Margin (5Y Median) ⓘ | 36.27% | 37.64% |
| Debt to Equity (Latest) ⓘ | 132.89% | 90.32% |
| Profit Margin (Latest) ⓘ | 44.62% | 20.10% |
| Free Cash Flow (Latest) ⓘ | $2.95B | |
Momentum (Price trend) | ||
| 3Y Return ⓘ | +85.70% | +27.88% |
| 12M Return (excl. last month) ⓘ | +0.38% | +1.16% |
| 6M Return ⓘ | -12.95% | -3.06% |
| Price vs. 200-Day MA ⓘ | -10.57% | -0.73% |
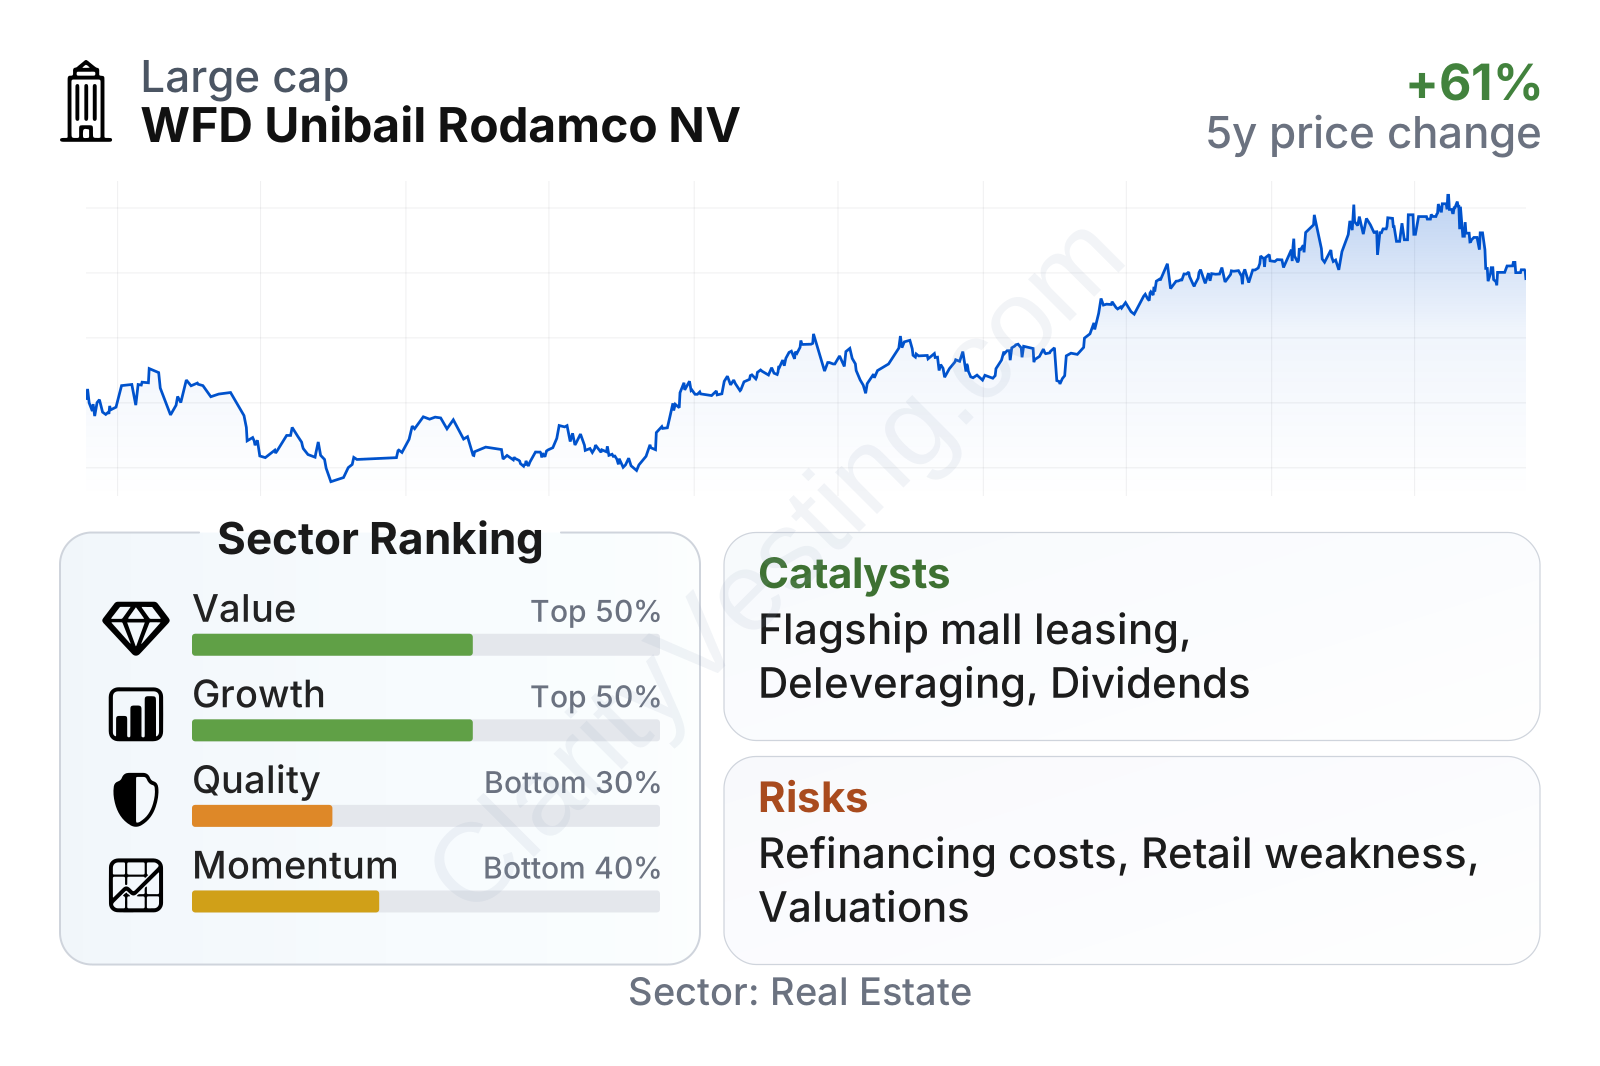
WFD Unibail Rodamco NV is a large real estate company with a market value in the mid-teens of billions of dollars and above-average share price volatility. The valuation profile looks inexpensive relative to many listed real estate peers: earnings multiple is well below the sector median, free cash flow yield is notably higher, and operating earnings relative to enterprise value are also strong. In plain terms, the market is not assigning a rich valuation despite a substantial recovery in cash generation.
Profitability is mixed in an interesting way. Recent returns on capital, equity, and assets are better than the sector median, and margins are unusually high for the industry. However, the longer-term quality profile is weaker because the five-year averages still reflect the difficult years of restructuring, disposals, and property revaluations. Balance sheet leverage has improved compared with many peers on a net debt to EBITDA basis, but debt to equity remains elevated and interest coverage is still on the soft side for comfort.
Price performance has been strong over the last three years, but the shorter-term picture is less convincing. The shares have pulled back from recent highs and sit below their longer-term average trend, which suggests that the market has become more cautious after a major rerating.
Growth
Retail real estate is not a high-growth sector in the same way as software or semiconductors, but high-quality malls in major urban areas can still grow steadily. The industry backdrop is better than many assume. Leading shopping centers have benefited from tenant demand for prime physical locations, rising sales productivity in the best assets, and the continued role of stores as both sales points and brand showrooms. Luxury brands, food and beverage operators, and entertainment concepts have all helped support the best centers.
WFD Unibail Rodamco NV’s strategy is built around this premium segment. Rather than trying to compete across all types of malls, it concentrates on large, dominant assets in major European cities. That focus makes strategic sense because top assets typically attract stronger tenants, achieve better occupancy, and retain pricing power more effectively than secondary centers.
The multi-year trend in revenue per share has been encouraging even though the latest year showed some moderation. Over five years, revenue per share has grown at a rate above the sector median, which suggests the company has improved the earning power of the portfolio despite asset sales and a still-challenging retail environment in some regions. Margin expansion has been particularly notable, indicating that recent growth has not relied only on top-line recovery.
A visible catalyst has been the company’s balance sheet repair and portfolio simplification. After several years of deleveraging, disposals, and a tighter focus on core European assets, the group is in a more stable position than it was earlier in the decade. If leasing spreads, occupancy, and tenant sales remain healthy, rental income can continue to edge higher without requiring aggressive expansion.
The dividend trend also points to normalization. After a very low base in the earlier recovery period, the distribution per share has increased sharply over the last two years. That does not necessarily mean a smooth upward path from here, but it does show management has regained enough confidence in recurring cash generation to restore a more meaningful payout.
Another supportive factor is inflation-linked lease structures used in parts of Europe. In the right operating environment, these clauses can help rental income keep pace with higher prices. The company has also emphasized asset repositioning and redevelopment, which can create internal growth by improving tenant mix, foot traffic, and sales density rather than relying only on external acquisitions.
Recent company communications have continued to emphasize strong operational indicators in flagship destinations, active leasing, and progress on strategic simplification. For a long-term view, the most important opportunity is not explosive expansion but sustained cash flow improvement from a concentrated portfolio of prime assets.
Risks
This article is for informational purposes only and does not constitute financial advice. Some content is AI-generated. See Disclaimer