Stock Analysis · Tyson Foods Inc (TSN)
Overview
Tyson Foods is one of the largest food companies in the United States. It processes and sells protein products such as chicken, beef, pork, and prepared foods through well-known retail and foodservice brands. Its products are sold to grocery stores, restaurants, schools, military channels, and industrial customers, making it a broad supplier to both households and commercial food buyers.
The business is organized into a few major operating segments. Based on the latest annual reporting structure and recent mix, revenue is mainly generated from the following sources, listed from largest to smallest:
- Beef: about 39% of revenue. This includes processing and selling boxed beef and case-ready products, largely in the U.S. market.
- Chicken: about 31% of revenue. This covers fresh, frozen, and value-added chicken products sold to retail and foodservice customers.
- Prepared Foods: about 18% of revenue. This segment includes branded ready-to-eat and ready-to-cook items such as frozen foods, deli meats, bacon, sausage, sandwiches, and snacks.
- Pork: about 10% of revenue. This includes fresh pork and related products.
- International/Other: about 2% of revenue. This mainly reflects overseas operations and smaller business activities.
For a long-term reader, the key point is that Tyson is not a niche food producer. It is a large-scale protein processor with meaningful exposure to commodity meat markets and a smaller but strategically important branded foods business. That mix creates resilience through diversification, but it also means earnings can swing sharply when livestock costs, feed costs, or meat spreads move against the company.
Over the last several years, sales have stayed around the low-to-mid $50 billion range, which shows the underlying scale of the franchise. The bigger issue has not been revenue size, but how much of that revenue turns into profit. After strong profitability in 2021 and 2022, margins compressed heavily in 2023, then recovered only partially afterward. That pattern matters more than top-line stability because Tyson operates in a business where small margin changes can have a large effect on earnings.
The financial flow highlights that Tyson remains a very large revenue business, but operating profit has become much thinner than it was a few years ago. Sales have been relatively stable, while the cost of producing those sales has absorbed most of the benefit, leaving less room for profits and cash generation than during the earlier upcycle.
Key Figures
| Metric | Value | Sector ⓘ |
|---|---|---|
| Date | Oct 17, 2026 | |
| Context | ||
| Sector | Consumer Defensive | |
| Industry | Farm Products | |
| Market Cap ⓘ | $18.85B | |
| Beta ⓘ | 0.40 | |
Value (Cheapness) | ||
| P/E Ratio ⓘ | 33.07 | 17.88 |
| P/B Ratio ⓘ | 1.05 | 1.29 |
| FCF Yield ⓘ | 6.16% | 12.39% |
| Dividend Yield ⓘ | 0.94% | 2.85% |
| EBIT / EV ⓘ | 4.77% | 6.43% |
| PEG ⓘ | 1.04 | |
Growth (Business expansion) | ||
| Revenue Growth ⓘ | -0.10% | 4.10% |
| RPS Growth (5Y CAGR) ⓘ | 4.96% | 6.18% |
| EPS Growth (5Y CAGR) ⓘ | -24.54% | -13.59% |
| BVPS Growth (5Y CAGR) ⓘ | 1.70% | 3.20% |
| Margin Growth (5Y Trend) ⓘ | -7.26% | -0.15% |
| FCF Growth (5Y CAGR) ⓘ | -18.22% | 4.10% |
| DPS Growth (5Y CAGR) ⓘ | 3.54% | 6.79% |
Quality (Business durability) | ||
| ROIC (Latest) ⓘ | 3.39% | 12.34% |
| ROA (Latest) ⓘ | 1.59% | 6.30% |
| ROIC (5Y Median) ⓘ | 4.24% | 10.49% |
| ROA (5Y Median) ⓘ | 2.18% | 5.44% |
| Net Debt / EBIT (Latest) ⓘ | 5.98 | 1.96 |
| Net Debt / EBIT (5Y Median) ⓘ | 3.37 | 2.35 |
| Net Debt / EBITDA (Latest) ⓘ | 2.79 | 1.38 |
| Net Debt / Assets ⓘ | 20.40% | 21.51% |
| EBITDA / Interest ⓘ | 6.42 | 9.46 |
| Operating Margin (Latest) ⓘ | 2.18% | 8.87% |
| Operating Margin (5Y Median) ⓘ | 2.95% | 9.53% |
| Debt to Equity (Latest) ⓘ | 44.28% | 72.35% |
| Profit Margin (Latest) ⓘ | 1.03% | 5.40% |
| Free Cash Flow (Latest) ⓘ | $1.16B | |
Momentum (Price trend) | ||
| 3Y Return ⓘ | +28.34% | +20.92% |
| 12M Return (excl. last month) ⓘ | -0.52% | +2.13% |
| 6M Return ⓘ | -15.05% | +1.26% |
| Price vs. 200-Day MA ⓘ | -8.75% | +1.39% |
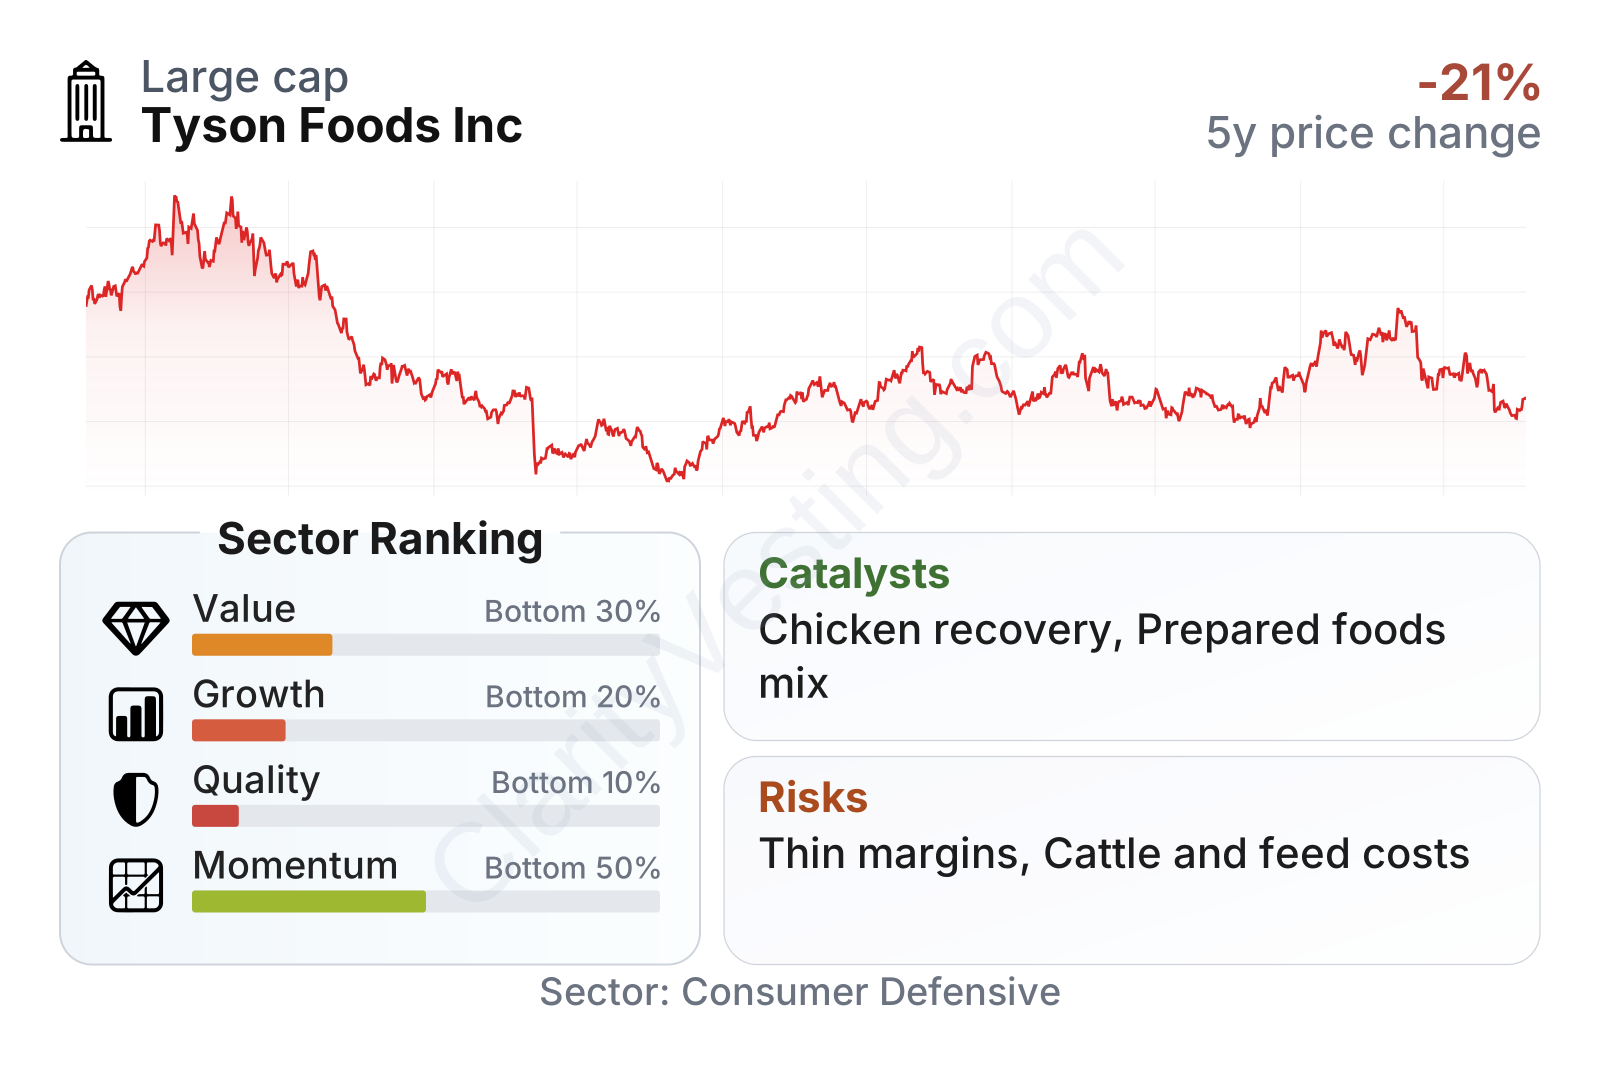
Tyson is a large-cap defensive food company with relatively low share-price volatility, as shown by its beta well below 1. That can make the stock move less aggressively than the broader market. However, the broader quality and growth picture is weaker than the company’s size might suggest. The current profile points to below-sector profitability, below-sector growth, and only middling recent price momentum.
On valuation, the stock screens as expensive on earnings compared with the sector median, while looking closer to normal on book value. Free cash flow yield and dividend yield are both below the sector median, which suggests the current market price is not especially cheap relative to Tyson’s present cash generation. In short, the company’s scale and stability are clear, but the table shows that recent operating performance has not matched the premium implied by its earnings multiple.
Growth
The sector itself is mature rather than high growth. Demand for protein products tends to be supported by population growth, food consumption, and the defensive nature of staple spending, but this is not usually a fast-expanding industry. For Tyson, long-term growth is less about entering a booming market and more about improving mix, efficiency, plant utilization, and branded product penetration.
That strategy makes sense. Commodity meat processing tends to be cyclical and margin-sensitive, while branded prepared foods can offer steadier pricing power and better profitability. Tyson has continued to emphasize operational improvement, network efficiency, and stronger execution in chicken, which is especially important because that segment has historically had large swings in performance. If the company can raise margins in chicken and expand prepared foods faster than commodity categories, earnings growth could improve even without dramatic revenue growth.
Revenue growth has been uneven. Tyson moved from a period of strong expansion in 2021 and 2022 to flat or negative comparisons in parts of 2023 and 2024, followed by a modest return to growth. More recently, growth has remained low, which reinforces the idea that the main earnings lever is margin recovery rather than rapid sales expansion.
Cash generation has also improved from the trough. Free cash flow fell sharply during the downturn, then recovered into a more solid range above $1 billion. That is an encouraging sign because it shows the business still has meaningful cash-producing capacity when operations normalize. For a company in a capital-intensive food business, that matters more than short bursts of accounting profit.
As for catalysts, the most important ones are internal. Better plant efficiency, healthier chicken economics, and a stronger contribution from prepared foods could all lift profitability. Tyson has also continued investing in automation, productivity, and supply chain improvements, which can support margins over time. A separate tailwind is that protein demand remains durable across retail and foodservice channels, even when consumers trade down on other categories.
Recent company updates have also pointed to ongoing efforts to improve the chicken business and streamline operations. Those changes do not transform Tyson into a high-growth company, but they can still create a meaningful earnings opportunity because the base business is so large. In a company of this size, even a modest improvement in margin can have an outsized effect on net income.
Risks
This article is for informational purposes only and does not constitute financial advice. Some content is AI-generated. See Disclaimer


