Stock Analysis · UL Solutions Inc (ULS)
Overview
UL Solutions is a testing, inspection, and certification company. In simple terms, it helps manufacturers, product developers, and industrial customers prove that their products are safe, compliant, and ready for market. Its work covers areas such as consumer products, industrial equipment, energy systems, software and cybersecurity, sustainability claims, and supply chain verification. The company is best known for the long history of the UL brand in safety standards, but today its business is broader than a traditional product-testing lab.
The company operates mainly through two business segments. Based on recent annual reporting, revenue is concentrated as follows:
- Testing, Inspection and Certification (TIC): about 83% of revenue. This is the core activity. It includes testing products against safety and performance requirements, certifying compliance, inspection services, auditing, and related recurring services used by manufacturers and regulated industries.
- Software and Advisory: about 17% of revenue. This includes compliance and safety software, training, sustainability-related advisory work, and data-driven tools that help customers manage risk, reporting, and operational processes.
Within the core TIC activities, the customer base is diversified across end markets including industrials, consumer goods, automotive, energy, built environment, and electronics. That mix matters because it reduces dependence on a single product cycle. It also means UL Solutions can benefit from several long-term trends at once: tighter regulation, more complex supply chains, electrification, and growing demand for independent verification.
The business model is attractive because a meaningful share of work is tied to mandatory compliance, repeat testing, follow-up services, and long-standing customer relationships. Over time, that can create steady demand and relatively resilient margins, especially for a company with an established name and deep standards expertise.
The financial flow over the last several years shows a company that has expanded revenue steadily while improving operating profit faster than sales. Gross profit has risen consistently, and operating income has moved up from the mid-$200 million range in 2021 to above $500 million in 2025, pointing to stronger efficiency and scale.
Key Figures
| Metric | Value | Sector ⓘ |
|---|---|---|
| Date | Oct 24, 2026 | |
| Context | ||
| Sector | Industrials | |
| Industry | Specialty Business Services | |
| Market Cap ⓘ | $14.81B | |
| Beta ⓘ | 0.71 | |
Value (Cheapness) | ||
| P/E Ratio ⓘ | 29.46 | 22.29 |
| P/B Ratio ⓘ | 9.65 | 1.98 |
| FCF Yield ⓘ | 2.94% | 6.26% |
| Dividend Yield ⓘ | 0.75% | 1.92% |
| EBIT / EV ⓘ | 5.59% | 4.83% |
| PEG ⓘ | 1.33 | |
Growth (Business expansion) | ||
| Revenue Growth ⓘ | 5.20% | 9.30% |
| RPS Growth (5Y CAGR) ⓘ | 4.55% | 7.76% |
| EPS Growth (5Y CAGR) ⓘ | 53.12% | -13.17% |
| BVPS Growth (5Y CAGR) ⓘ | -14.90% | 6.13% |
| Margin Growth (5Y Trend) ⓘ | 5.54% | 0.74% |
| FCF Growth (5Y CAGR) ⓘ | 6.44% | 10.79% |
| DPS Growth (5Y CAGR) ⓘ | -15.40% | 9.41% |
Quality (Business durability) | ||
| ROIC (Latest) ⓘ | 31.20% | 10.75% |
| ROA (Latest) ⓘ | 16.75% | 5.41% |
| ROIC (5Y Median) ⓘ | N/A | 9.37% |
| ROA (5Y Median) ⓘ | 9.53% | 4.95% |
| Net Debt / EBIT (Latest) ⓘ | 0.16 | 2.04 |
| Net Debt / EBIT (5Y Median) ⓘ | 1.07 | 2.27 |
| Net Debt / EBITDA (Latest) ⓘ | 0.13 | 1.39 |
| Net Debt / Assets ⓘ | 3.75% | 19.27% |
| EBITDA / Interest ⓘ | 29.08 | 9.58 |
| Operating Margin (Latest) ⓘ | 23.54% | 10.49% |
| Operating Margin (5Y Median) ⓘ | 15.87% | 10.30% |
| Debt to Equity (Latest) ⓘ | 34.55% | 64.82% |
| Profit Margin (Latest) ⓘ | 16.08% | 6.67% |
| Free Cash Flow (Latest) ⓘ | $436.00M | |
Momentum (Price trend) | ||
| 3Y Return ⓘ | N/A | +67.77% |
| 12M Return (excl. last month) ⓘ | -1.97% | +12.05% |
| 6M Return ⓘ | -19.00% | 0.00% |
| Price vs. 200-Day MA ⓘ | -10.16% | +0.67% |
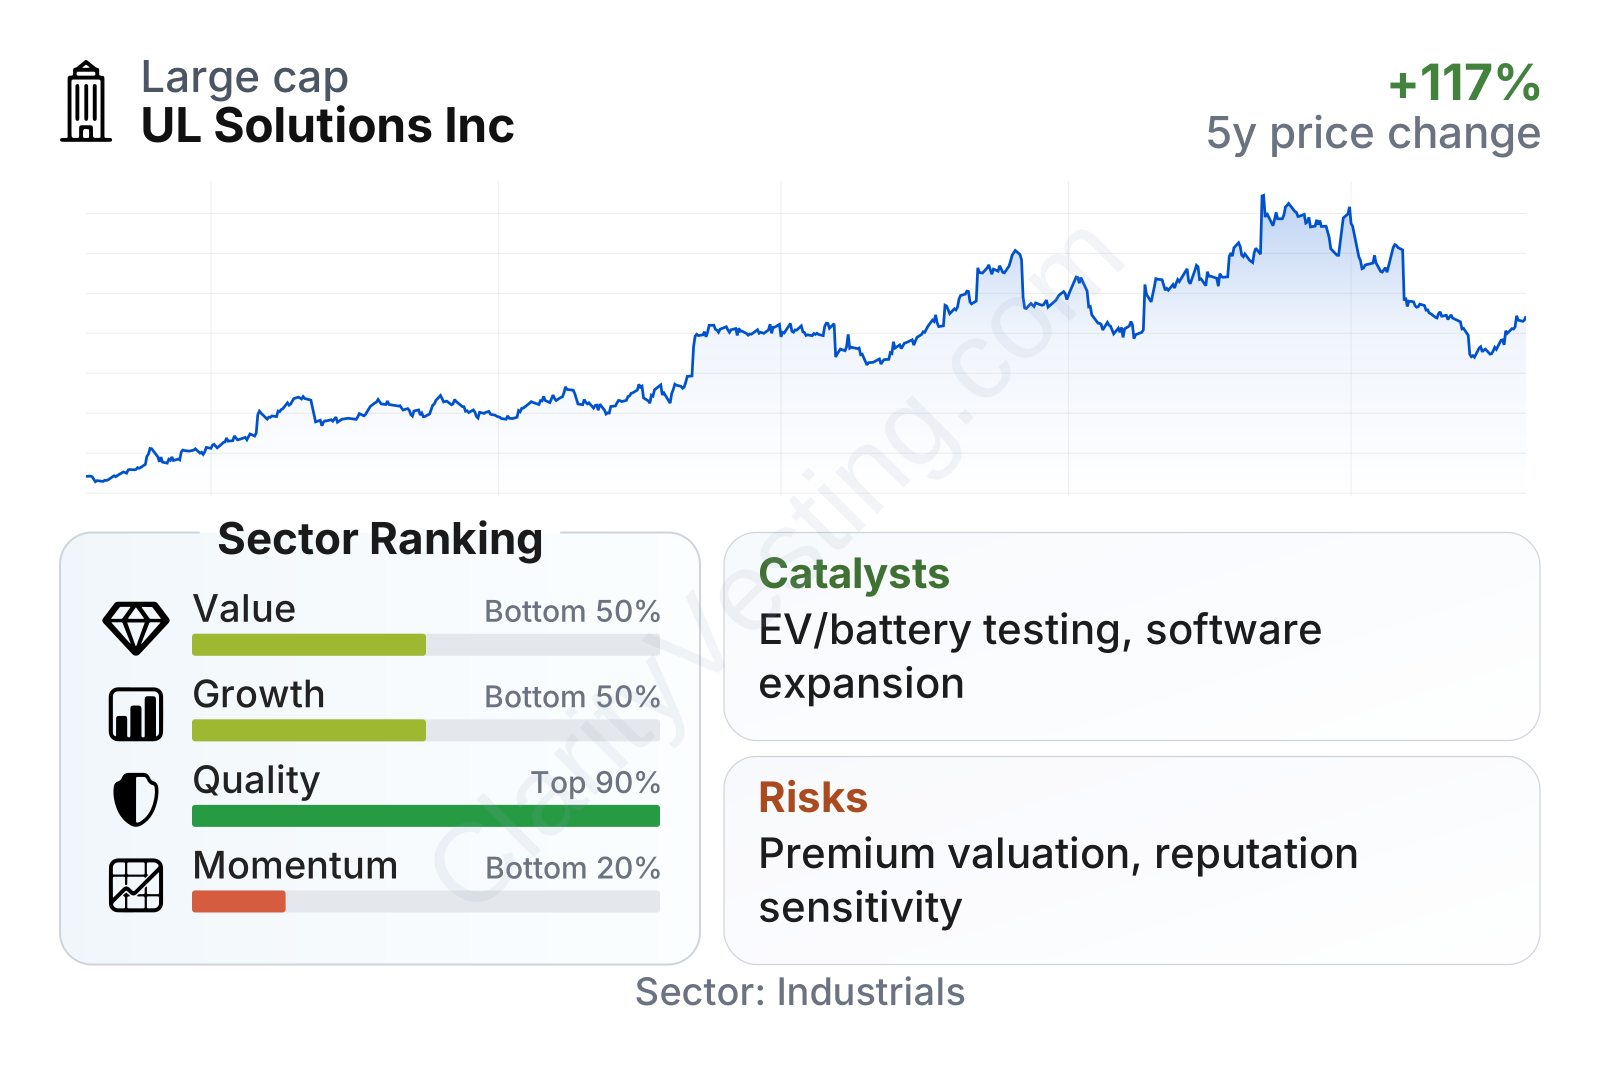
UL Solutions sits in a mid-to-large capitalization range for its niche and has a relatively low beta, which suggests the stock has historically moved less than the broader market. Profitability and balance-sheet quality stand out much more than valuation or growth. The quality profile is particularly strong: returns on capital and assets are well above sector medians, operating margin is far ahead of peers, and leverage has come down sharply. By contrast, the valuation profile looks less favorable, with a higher earnings multiple, a much higher price-to-book ratio, and a lower free-cash-flow yield than the sector median.
The overall picture is a business with unusually solid economics for an industrial services company, but one that the market already recognizes as a premium asset.
Growth
UL Solutions operates in a sector with durable structural support. Testing, certification, compliance, and risk management tend to grow as products become more technical, regulations become more demanding, and companies face greater liability and brand risk. That backdrop is especially relevant in areas such as electric vehicles, batteries, renewable energy infrastructure, grid equipment, connected devices, industrial automation, and cybersecurity assurance.
The company’s strategy appears coherent for that environment. It is not relying on a single breakthrough product; instead, it is broadening capabilities across safety science, regulatory expertise, software, and advisory services. That matters because customers increasingly need bundled support rather than one-time lab testing. A manufacturer launching a new battery platform, for example, may need design review, certification, factory assessments, software-related checks, and ongoing compliance updates. UL Solutions is positioned to capture several steps in that chain.
Recent growth has been positive but not explosive. Year-over-year revenue increases have generally stayed in the mid-single-digit to high-single-digit range, which is slower than the broader sector median but still consistent with a stable and expanding service franchise. This is more characteristic of a mature quality-compounding business than a high-velocity growth company.
Cash generation has also improved meaningfully. Trailing free cash flow has moved from roughly the low-$300 million range to around $450 million over the observed period. That is important because it shows that reported earnings are being supported by real cash creation, giving the company more room for reinvestment, debt reduction, dividends, and flexibility for acquisitions or capacity expansion.
A notable catalyst is the rise of electrification and energy transition testing needs. Batteries, EV components, charging systems, energy storage, and grid modernization all require independent validation and safety work. Another catalyst is digital trust: as physical products increasingly incorporate software and connectivity, compliance is no longer only about hardware safety. That widens the addressable market for a company that combines technical testing with software and advisory capabilities.
Recent company communications have also pointed to continuing demand in high-growth areas such as sustainability, renewable energy, and emerging technologies. These are not short-term spikes; they reflect broader industrial changes that can support multi-year demand.
Risks
This article is for informational purposes only and does not constitute financial advice. Some content is AI-generated. See Disclaimer


