Stock Analysis · Frontier Group Holdings Inc (ULCC)
Overview
Frontier Group Holdings Inc. is the parent company of Frontier Airlines, a U.S. ultra-low-cost carrier. Its model is built around offering low base fares and then charging separately for optional services. This approach is common in the budget airline segment: the ticket gets passengers onto the plane, while add-ons help lift revenue per traveler.
The company operates primarily in the domestic leisure and visiting-friends-and-relatives travel market, with some international service to destinations in the Americas. Its network focuses on price-sensitive travelers, and its operating model is designed around a single-family aircraft fleet, dense seating, and high aircraft utilization in order to keep unit costs low.
Revenue comes mainly from passenger transportation and a large contribution from ancillary products. Based on company reporting structure and recent filings, the main sources of revenue are approximately the following:
- Passenger ticket revenue: about 60% to 70% of total revenue. This is the base airfare paid for transportation.
- Ancillary revenue: about 30% to 40% of total revenue. This includes baggage fees, seat selection, change-related fees, priority boarding, bundled fare products, onboard purchases, and other travel-related extras.
- Other revenue: typically a small residual share. This can include loyalty-related or partner-related items depending on reporting classifications in a given period.
That mix matters because Frontier is not simply selling seats; it is selling a low advertised fare and monetizing the trip through additional services. This can work well when demand is healthy and travelers remain highly price conscious, but it also makes the company sensitive to competition on total trip price, not just the headline ticket.
Over the last several years, revenue has recovered and expanded from pandemic-era levels, but profitability has been uneven. Costs have absorbed much of that sales growth, showing that scale alone has not yet translated into consistently strong margins.
The long-term pattern shows a business that rebuilt revenue meaningfully after 2021, reached positive net income in 2024, and then slipped back into operating and net losses in 2025 as cost pressure returned. For Frontier, the central question is not whether it can fill planes, but whether it can do so at fares and fee levels that cover fuel, labor, aircraft ownership, and overhead with enough room left for durable earnings.
Key Figures
| Metric | Value | Sector ⓘ |
|---|---|---|
| Date | Oct 17, 2026 | |
| Context | ||
| Sector | Industrials | |
| Industry | Airlines | |
| Market Cap ⓘ | $1.28B | |
| Beta ⓘ | 2.65 | |
Value (Cheapness) | ||
| P/E Ratio ⓘ | N/A | 22.10 |
| P/B Ratio ⓘ | 8.25 | 1.97 |
| FCF Yield ⓘ | -9.81% | 6.38% |
| Dividend Yield ⓘ | N/A | 1.94% |
| EBIT / EV ⓘ | -6.80% | 4.79% |
| PEG ⓘ | N/A | |
Growth (Business expansion) | ||
| Revenue Growth ⓘ | 37.70% | 9.30% |
| RPS Growth (5Y CAGR) ⓘ | 14.29% | 7.81% |
| EPS Growth (5Y CAGR) ⓘ | N/A | -13.06% |
| BVPS Growth (5Y CAGR) ⓘ | -3.30% | 6.14% |
| Margin Growth (5Y Trend) ⓘ | N/A | 0.88% |
| FCF Growth (5Y CAGR) ⓘ | N/A | 11.01% |
| DPS Growth (5Y CAGR) ⓘ | -62.98% | 9.48% |
Quality (Business durability) | ||
| ROIC (Latest) ⓘ | -31.26% | 10.84% |
| ROA (Latest) ⓘ | -5.54% | 5.41% |
| ROIC (5Y Median) ⓘ | -2.90% | 9.38% |
| ROA (5Y Median) ⓘ | -0.85% | 4.95% |
| Net Debt / EBIT (Latest) ⓘ | N/A | 2.08 |
| Net Debt / EBIT (5Y Median) ⓘ | N/A | 2.27 |
| Net Debt / EBITDA (Latest) ⓘ | N/A | 1.39 |
| Net Debt / Assets ⓘ | 59.19% | 19.28% |
| EBITDA / Interest ⓘ | N/A | 9.58 |
| Operating Margin (Latest) ⓘ | -9.22% | 10.50% |
| Operating Margin (5Y Median) ⓘ | -1.05% | 10.29% |
| Debt to Equity (Latest) ⓘ | 3854.41% | 65.48% |
| Profit Margin (Latest) ⓘ | -9.29% | 6.67% |
| Free Cash Flow (Latest) ⓘ | -$126.00M | |
Momentum (Price trend) | ||
| 3Y Return ⓘ | +9.17% | +61.68% |
| 12M Return (excl. last month) ⓘ | +8.69% | +12.58% |
| 6M Return ⓘ | +23.23% | 0.00% |
| Price vs. 200-Day MA ⓘ | -9.49% | +0.02% |
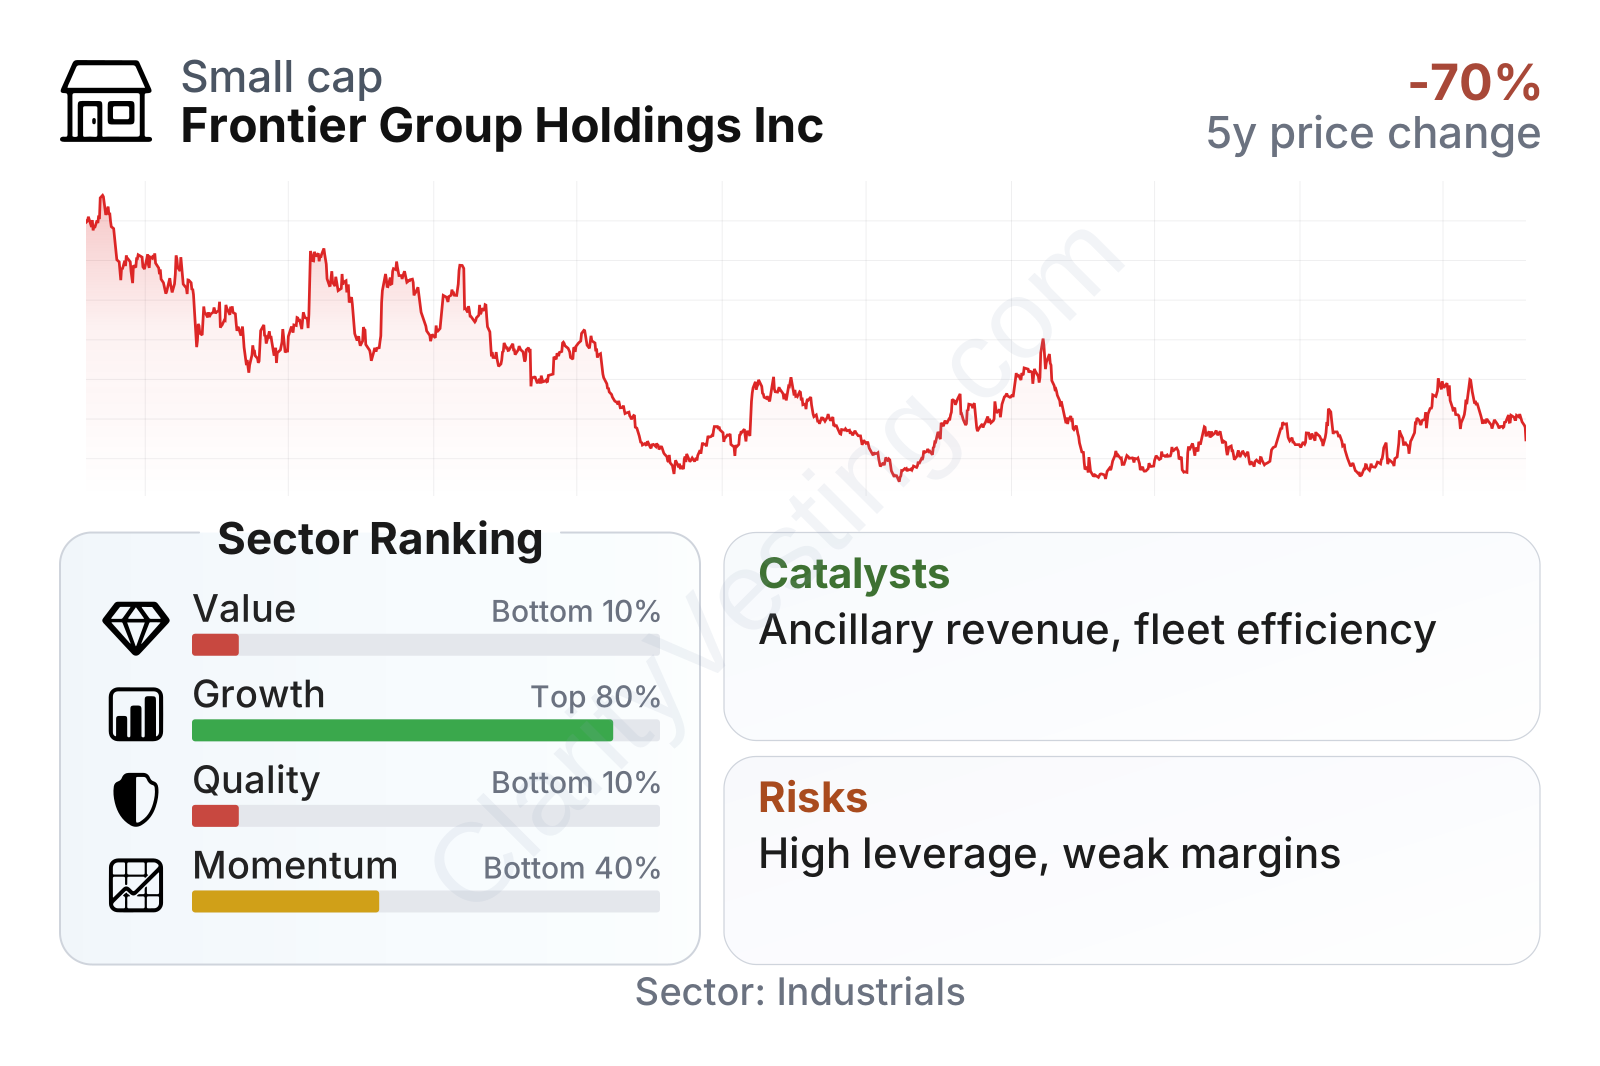
Frontier is a relatively small public airline by market value, and its share price history has been volatile, which is not unusual for a carrier exposed to fuel prices, travel cycles, and changing fare competition. The latest broad factor view is mixed: growth and recent price momentum look stronger than much of the sector, while value and quality rank near the bottom. In practical terms, that means the market is seeing improving activity and recent trading strength, but the underlying business is still dealing with weak profitability, negative free cash flow, and a stretched balance sheet.
The company’s beta is high, which signals that the stock has tended to move much more sharply than the broader market. That fits the economics of budget airlines: small changes in fares, load factors, or operating costs can have an outsized effect on earnings.
Growth
The airline industry is mature, but the ultra-low-cost niche can still grow by stimulating demand with lower fares and by taking share in price-sensitive routes. Frontier’s strategy remains logical for that segment. The company continues to focus on cost discipline, simplified fleet economics, network flexibility, and ancillary monetization. If consumers remain budget conscious, that positioning can create room for traffic growth even when the broader economy is uneven.
A major strategic support is fleet standardization around the Airbus A320 family, including newer, more fuel-efficient aircraft. For a low-fare airline, this matters because fuel efficiency, seating density, and maintenance simplicity are central to preserving a cost advantage. Frontier has also emphasized direct distribution, fare bundles, and its loyalty platform to improve revenue per passenger beyond the base ticket.
Recent revenue growth has reaccelerated after a weaker period. The most recent year-over-year increase stands far above the sector median, suggesting Frontier is currently seeing a stronger rebound in top-line activity than many industrial peers. Even so, the quarterly history also shows that airline growth can change quickly from strong expansion to flat or negative readings, so consistency remains unproven.
Free cash flow is the weaker part of the growth profile. Even with demand improving, Frontier has posted deeply negative trailing cash generation in recent periods. That usually reflects a combination of thin operating profits and heavy aircraft-related capital needs. For a long-term view, revenue growth alone is not enough; the company needs that growth to convert into cash after fleet spending.
As for catalysts, one meaningful opportunity is continued normalization in leisure travel combined with customers trading down to cheaper fare options. Another is the company’s ability to expand ancillary revenue per passenger through bundles and premium add-ons without materially raising its cost base. If Frontier can improve load factors and unit revenue while newer aircraft help contain fuel burn and maintenance costs, operating leverage could become more visible.
Recent company communications have also pointed to network adjustments, capacity discipline, and efforts to target routes with better returns rather than growth for its own sake. That is important. For an ultra-low-cost carrier, growth is most valuable when it improves margins, not when it simply adds more seats into already competitive markets.
Risks
This article is for informational purposes only and does not constitute financial advice. Some content is AI-generated. See Disclaimer


