Stock Analysis · United Industrial Corporation Ltd (UILCY)
Overview
United Industrial Corporation Ltd is a Singapore-based holding company best known for owning a large portfolio of investment properties, development projects, and hotel assets. Even though it is classified under diversified real estate, the business is heavily centered on property ownership and property-related operations in Singapore, with additional exposure to hospitality. For U.S. readers, the UILCY ticker represents the company through an over-the-counter listing rather than a primary exchange listing.
The company’s economic engine is recurring rental income from commercial and mixed-use properties, supported by property development profits that can be more uneven from year to year. It also has hotel and related operating income through hospitality assets. Based on recent annual reporting, revenue appears to come mainly from the following areas:
- Property investment: approximately 50% to 60% of revenue. This usually includes office, retail, and mixed-use rental income, plus related property management streams.
- Property development: approximately 25% to 35% of revenue. This reflects sales recognition from residential or mixed-use development projects, which can fluctuate depending on project completion timing.
- Hotel operations: approximately 10% to 20% of revenue. This includes room revenue, food and beverage, and other hotel-related services.
Over the last several years, total revenue has moved upward from roughly $554 million in 2021 to about $783 million in 2025, while operating profit remained substantial throughout the period. That combination suggests a business supported by hard assets and recurring cash generation, even if yearly earnings can vary with revaluation movements, development timing, and financing costs.
The business mix points to a relatively stable core from rent-producing assets, with an added layer of upside and volatility from development and hospitality. Another visible feature is that revenue has grown steadily, while costs have also risen, especially interest expense, making capital discipline an important part of the investment case.
Key Figures
| Metric | Value | Sector ⓘ |
|---|---|---|
| Date | Oct 17, 2026 | |
| Context | ||
| Sector | Real Estate | |
| Industry | Real Estate - Diversified | |
| Market Cap ⓘ | $3.55B | |
| Beta ⓘ | 0.34 | |
Value (Cheapness) | ||
| P/E Ratio ⓘ | 12.24 | 17.38 |
| P/B Ratio ⓘ | 0.44 | 0.85 |
| FCF Yield ⓘ | 12.71% | 7.38% |
| Dividend Yield ⓘ | 1.42% | 4.85% |
| EBIT / EV ⓘ | N/A | 3.78% |
| PEG ⓘ | N/A | |
Growth (Business expansion) | ||
| Revenue Growth ⓘ | 14.20% | 5.30% |
| RPS Growth (5Y CAGR) ⓘ | 9.03% | 6.02% |
| EPS Growth (5Y CAGR) ⓘ | -38.54% | -11.37% |
| BVPS Growth (5Y CAGR) ⓘ | 1.14% | 0.45% |
| Margin Growth (5Y Trend) ⓘ | -20.29% | -0.22% |
| FCF Growth (5Y CAGR) ⓘ | 18.17% | 5.40% |
| DPS Growth (5Y CAGR) ⓘ | 6.48% | 5.02% |
Quality (Business durability) | ||
| ROIC (Latest) ⓘ | 3.52% | 5.69% |
| ROE (Latest) ⓘ | 8.39% | 7.56% |
| ROA (Latest) ⓘ | 6.44% | 2.85% |
| ROIC (5Y Median) ⓘ | 4.19% | 4.22% |
| ROE (5Y Median) ⓘ | 3.70% | 6.03% |
| ROA (5Y Median) ⓘ | 2.91% | 2.44% |
| Net Debt / EBIT (Latest) ⓘ | 2.25 | 7.59 |
| Net Debt / EBIT (5Y Median) ⓘ | 0.98 | 8.40 |
| Net Debt / EBITDA (Latest) ⓘ | 1.83 | 5.27 |
| Net Debt / Assets ⓘ | 7.72% | 37.76% |
| EBITDA / Interest ⓘ | 8.32 | 4.10 |
| Operating Margin (Latest) ⓘ | 24.25% | 35.29% |
| Operating Margin (5Y Median) ⓘ | 51.68% | 37.31% |
| Debt to Equity (Latest) ⓘ | 11.45% | 88.87% |
| Profit Margin (Latest) ⓘ | 42.88% | 19.61% |
| Free Cash Flow (Latest) ⓘ | $451.19M | |
Momentum (Price trend) | ||
| 3Y Return ⓘ | +65.98% | +30.75% |
| 12M Return (excl. last month) ⓘ | +104.96% | +4.36% |
| 6M Return ⓘ | -8.73% | -2.52% |
| Price vs. 200-Day MA ⓘ | +8.44% | -2.34% |
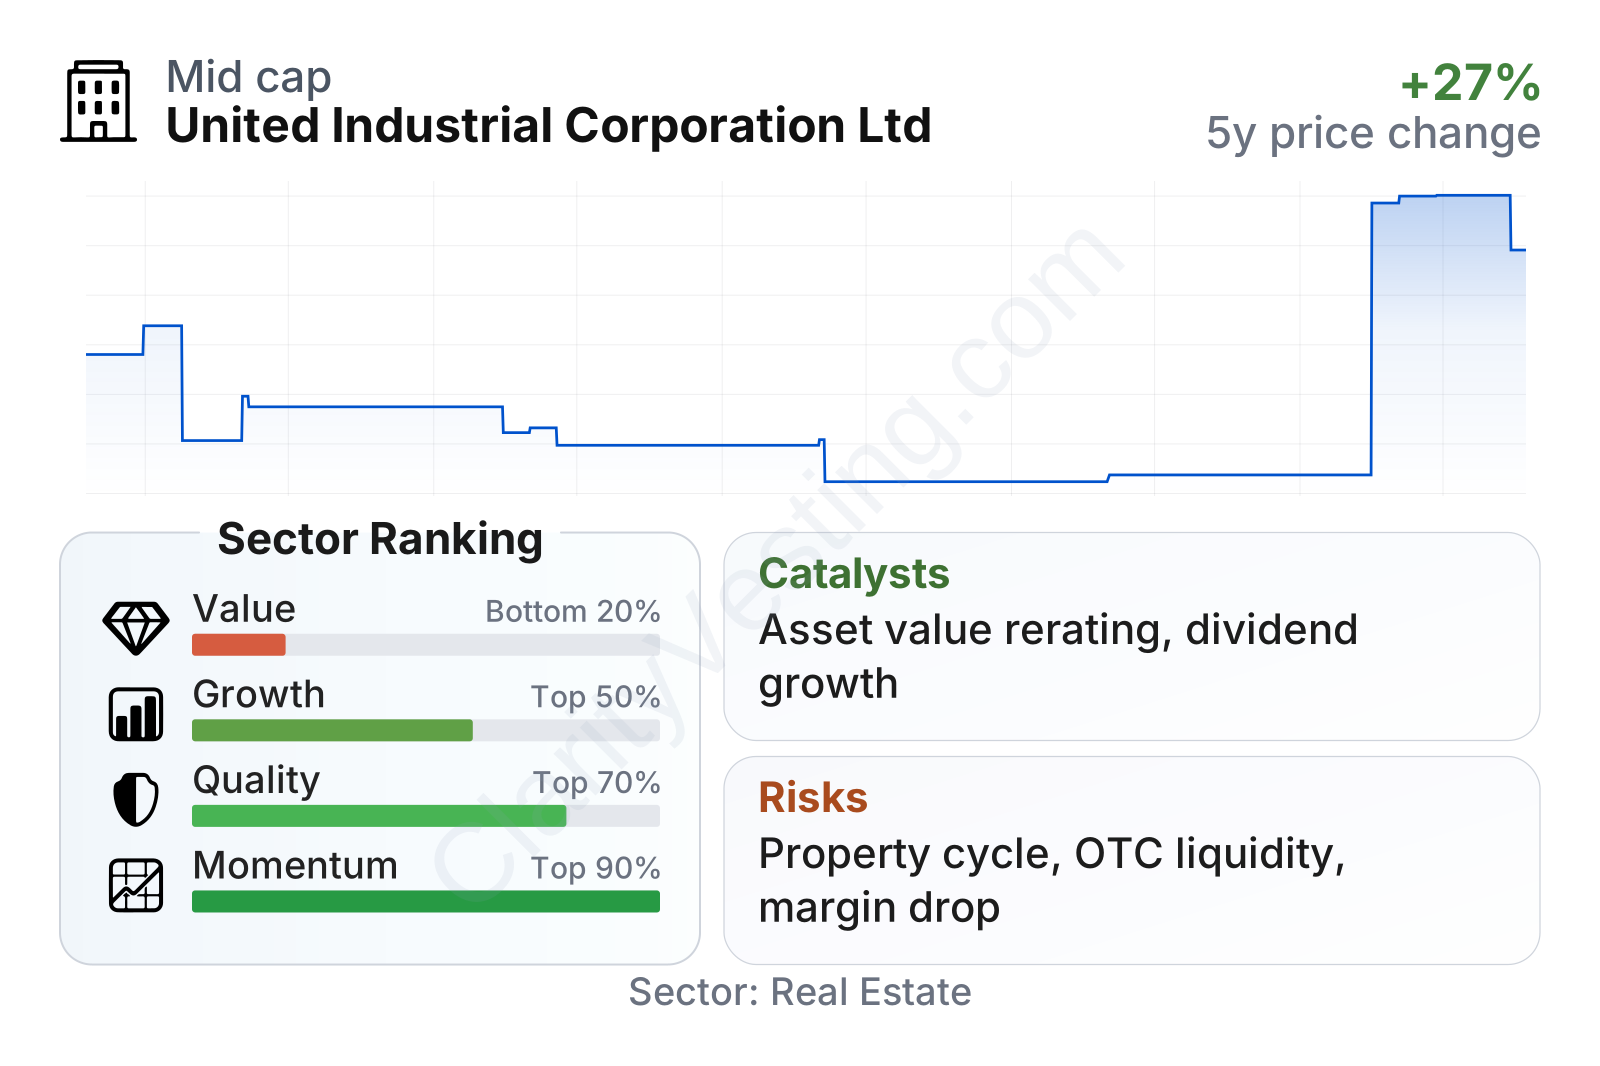
United Industrial sits in the mid-cap range and has had a very strong recent share-price move, far ahead of the typical company in its real estate peer group. The broader factor picture is mixed but understandable: value metrics look optically cheap, growth is above the sector median in several areas, balance-sheet quality is solid, and momentum is unusually strong. The weaker part is that profitability efficiency is not uniformly strong across all measures, especially when compared with the best performers in real estate.
The stock also carries a low beta, which suggests price movements have historically been less sensitive than the broader equity market. That can matter for a property company where much of the underlying value comes from tangible assets rather than purely cyclical operating expansion.
Growth
United Industrial operates in a sector where long-term growth is usually moderate rather than explosive. Real estate owners generally compound value through a mix of rent increases, occupancy stability, redevelopment, selective asset recycling, and occasional development gains. In Singapore, well-located assets can benefit from limited land supply, a strong legal framework, and continued demand for quality commercial and mixed-use space, although the pace depends on the economy and office or retail conditions.
The company’s strategy appears coherent for that environment. Its combination of investment properties, development capability, and hotel exposure gives it more than one avenue for expansion. Recurring rental income can provide stability, while development projects and hospitality recovery can add incremental growth. That is visible in the company’s revenue trend, which has advanced at a healthy pace over five years, and in free cash flow, which has expanded faster than many sector peers.
Revenue per share has shown a generally upward path from 2021 through 2025. That matters because it indicates the business has been adding economic output on a per-share basis rather than relying only on balance-sheet expansion. Recent year-over-year revenue growth was also ahead of the sector median, which supports the idea that the company has been growing faster than many diversified real estate peers.
Dividend per share has also increased over the last two years after being largely flat earlier in the period. That pattern suggests management has become more comfortable lifting shareholder distributions as operating conditions normalized and cash generation remained healthy. It is not a high-yield name relative to much of real estate, but the distribution trend has been positive.
A meaningful catalyst is the gap between the company’s market value and its book value. For property groups, that discount often narrows when asset values are better recognized by the market, when capital is returned more actively, or when corporate actions highlight the underlying worth of the portfolio. Another catalyst is continued monetization or optimization of prime assets, especially if management can keep rental performance stable while controlling financing costs.
Recent share-price behavior suggests the market has started to reassess the company more favorably. That does not by itself prove fundamental change, but it often coincides with greater attention to hidden asset value, improved operating trends, or expectations around portfolio actions.
Risks
This article is for informational purposes only and does not constitute financial advice. Some content is AI-generated. See Disclaimer


