Stock Analysis · Union Electric Company (UEPEO)
Overview
Union Electric Company operates as a regulated electric utility. In practical terms, it generates, transmits, and distributes electricity to homes, businesses, and industrial customers in its service territory. This is the classic utility model: the company provides an essential service, invests heavily in power plants and grid infrastructure, and then recovers those costs through rates approved by regulators.
For long-term analysis, the most important point is that this is not a highly cyclical business driven by changing consumer tastes. Demand for electricity tends to be steadier than in most industries, although weather, economic activity, fuel costs, and regulatory decisions can still move results from year to year.
Public company materials indicate that revenue is overwhelmingly tied to electricity operations rather than a broad mix of unrelated businesses. Based on the company’s profile as a regulated electric utility, the main revenue sources are best understood as:
- Retail electricity sales: the largest source by far, coming from residential, commercial, and industrial customers paying for delivered power and related grid service.
- Transmission and distribution-related revenue: regulated charges tied to moving electricity across the network and maintaining access to the grid.
- Wholesale or other electric operations: a smaller contribution that can include off-system sales, capacity-related activity, or other utility-related services when available.
Because the company is a regulated utility, revenue composition is usually less about product diversification and more about customer mix, allowed returns, and the timing of rate cases and capital recovery. Over recent years, total revenue has been volatile, but operating income and net income have remained comparatively resilient, showing the stabilizing effect of the regulated model even when top-line performance shifts.
The financial flow also highlights that profitability has generally held up even as costs and interest expense moved higher. One item deserves caution: the sharp jump shown for 2025 is unusually large for a regulated utility and should be read carefully alongside company filings to determine whether it reflects a structural change, accounting presentation effect, or a business combination rather than normal organic expansion.
Key Figures
| Metric | Value | Sector ⓘ |
|---|---|---|
| Date | Oct 17, 2026 | |
| Context | ||
| Sector | Utilities | |
| Industry | Utilities - Regulated Electric | |
| Market Cap ⓘ | $7.54B | |
| Beta ⓘ | N/A | |
Value (Cheapness) | ||
| P/E Ratio ⓘ | 13.72 | 17.28 |
| P/B Ratio ⓘ | 2.06 | 1.51 |
| FCF Yield ⓘ | -15.68% | 0.65% |
| Dividend Yield ⓘ | N/A | 3.77% |
| EBIT / EV ⓘ | 14.98% | 5.01% |
| PEG ⓘ | N/A | |
Growth (Business expansion) | ||
| Revenue Growth ⓘ | -17.00% | 6.10% |
| RPS Growth (5Y CAGR) ⓘ | 0.75% | 3.87% |
| EPS Growth (5Y CAGR) ⓘ | 9.31% | -11.30% |
| BVPS Growth (5Y CAGR) ⓘ | -14.11% | 4.23% |
| Margin Growth (5Y Trend) ⓘ | 7.71% | 3.57% |
| FCF Growth (5Y CAGR) ⓘ | -9.89% | -8.84% |
| DPS Growth (5Y CAGR) ⓘ | 28.95% | 4.84% |
Quality (Business durability) | ||
| ROIC (Latest) ⓘ | N/A | 6.53% |
| ROA (Latest) ⓘ | 6.31% | 3.20% |
| ROIC (5Y Median) ⓘ | 5.63% | 5.95% |
| ROA (5Y Median) ⓘ | 2.93% | 2.75% |
| Net Debt / EBIT (Latest) ⓘ | 3.93 | 7.13 |
| Net Debt / EBIT (5Y Median) ⓘ | 9.28 | 7.23 |
| Net Debt / EBITDA (Latest) ⓘ | 2.65 | 4.31 |
| Net Debt / Assets ⓘ | 35.06% | 38.42% |
| EBITDA / Interest ⓘ | 3.87 | 4.58 |
| Operating Margin (Latest) ⓘ | 28.54% | 20.83% |
| Operating Margin (5Y Median) ⓘ | 19.26% | 20.08% |
| Debt to Equity (Latest) ⓘ | 103.97% | 137.69% |
| Profit Margin (Latest) ⓘ | 18.16% | 11.37% |
| Free Cash Flow (Latest) ⓘ | -$1.18B | |
Momentum (Price trend) | ||
| 3Y Return ⓘ | +15.00% | +52.37% |
| 12M Return (excl. last month) ⓘ | +2.46% | +8.84% |
| 6M Return ⓘ | -2.24% | -3.95% |
| Price vs. 200-Day MA ⓘ | -1.73% | -0.79% |
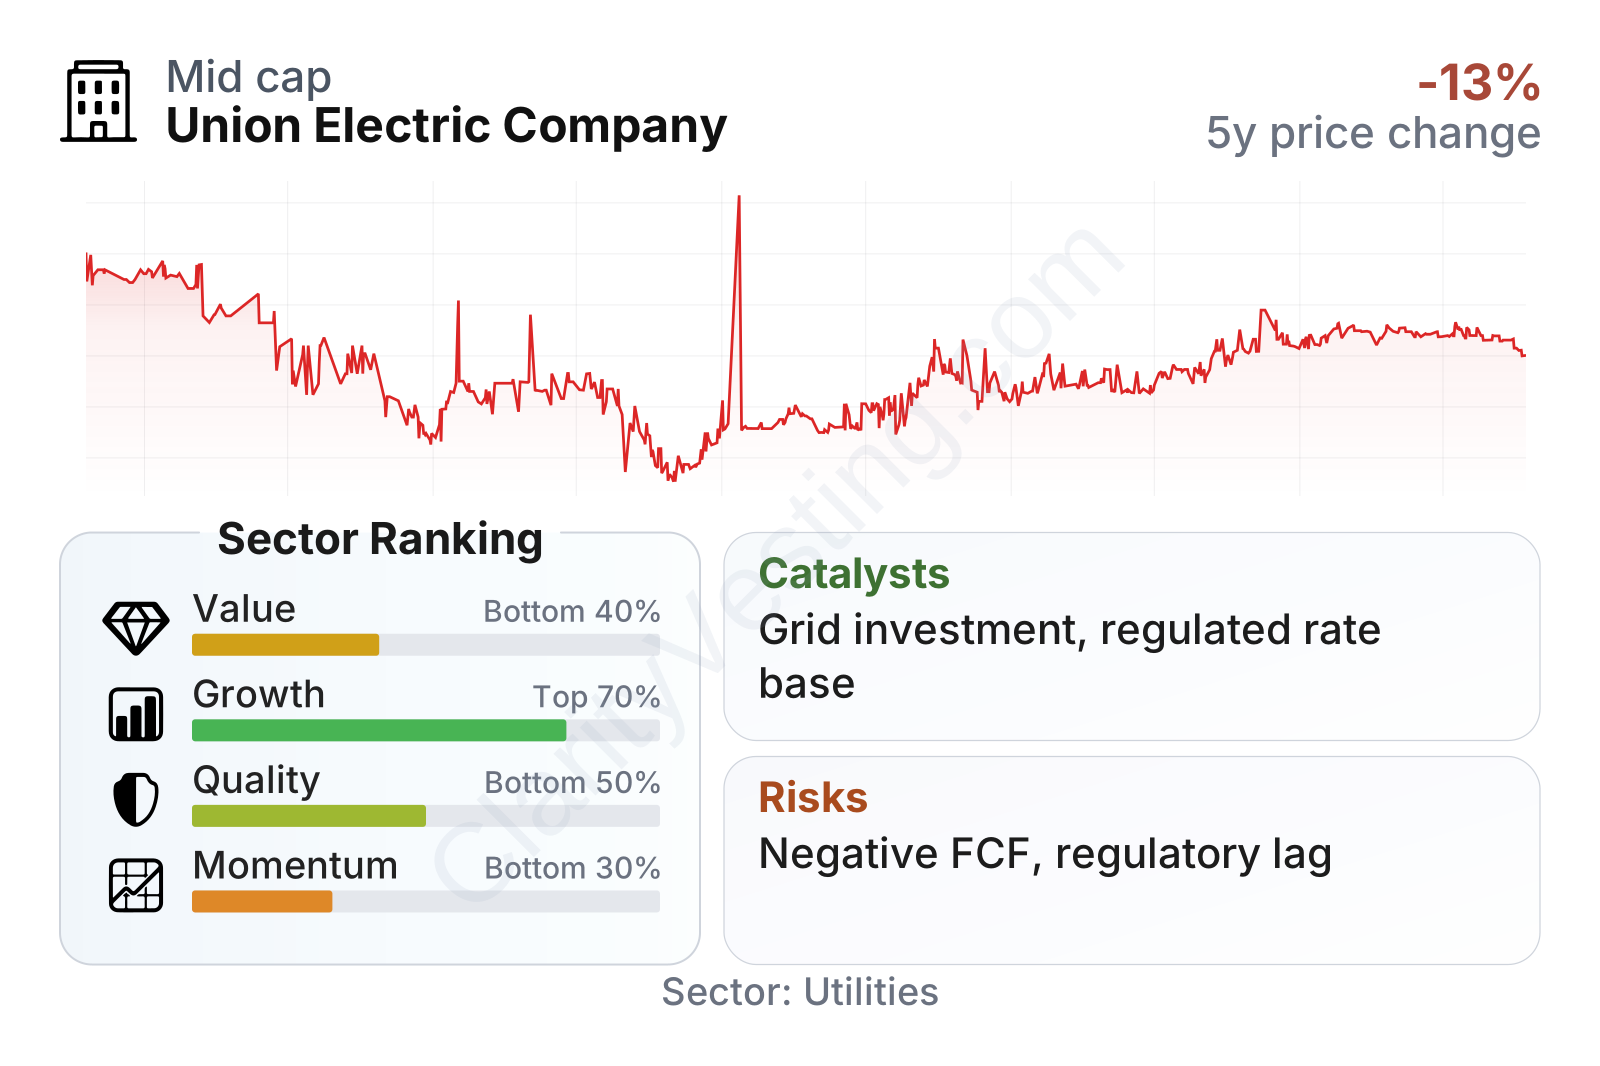
The overall profile is mixed. On valuation, the shares trade at an earnings multiple below the sector median, but that lower multiple comes with weaker free cash flow and no current trailing dividend yield in the metrics shown. On quality, profitability stands out positively, especially margins and return on assets, while leverage is meaningful but not extreme for a utility. Growth indicators are uneven: earnings growth over five years looks solid, yet revenue growth has been soft recently and book value trends are less favorable. Market performance has also lagged much of the sector over longer periods, even though the recent trading pattern appears more stable.
Growth
The electric utility sector is structurally supported by long-term demand for reliable power, grid modernization, and the need to replace or upgrade aging infrastructure. In the United States, this is also increasingly connected to electrification, data center demand, industrial reshoring, and investment in cleaner generation. That does not usually translate into rapid growth in the way technology businesses grow, but it can create a long runway for steady capital deployment and earnings expansion if regulators allow the company to earn an adequate return.
For Union Electric Company, the strategic logic is straightforward: invest in the grid and generation base, place those assets into the regulated rate base, and convert that spending into future earnings. This model tends to work best when management can keep projects on schedule, control financing costs, and maintain constructive regulatory relationships.
Revenue per share has been fairly uneven rather than consistently upward. That fits the utility pattern where weather, purchased power costs, fuel adjustments, and regulatory timing can create noise in sales. It also suggests that the long-term thesis here depends more on efficient capital investment and earnings quality than on straightforward top-line acceleration.
Free cash flow is an important pressure point. The latest reading is deeply negative, which is common during heavy infrastructure spending cycles, but it still matters because utilities finance that gap through debt, equity, or retained earnings. Negative free cash flow is not automatically a red flag in this industry; the key question is whether current spending is building regulated assets that can support future returns.
A notable potential catalyst is the broader U.S. push toward grid reliability and generation investment. Utilities with large regulated service territories can benefit from approved capital programs tied to transmission upgrades, storm hardening, cleaner energy additions, and customer growth. If the company is in a position to expand rate base through these projects, that can support earnings over a multiyear period.
Another point that may matter is the unusual 2025 step-up in reported revenue and profit. If confirmed in current filings as a lasting change in scale rather than a one-time accounting effect, it could materially alter how the company is viewed on growth and earnings capacity.
Risks
This article is for informational purposes only and does not constitute financial advice. Some content is AI-generated. See Disclaimer


