Stock Analysis · UDR Inc (UDR)
Overview
UDR Inc is a residential real estate investment trust, or REIT. In simple terms, it owns apartment communities, operates them, and earns income mainly from rent. The company focuses on higher-density markets in the United States, with a portfolio concentrated in coastal and other supply-constrained metropolitan areas where demand for housing tends to stay relatively resilient over time. As a REIT, UDR is built around collecting recurring cash flow from residential properties and distributing a meaningful share of that cash flow to shareholders through dividends.
Its revenue base is relatively straightforward compared with many other public companies. The largest source is rental and other property income from apartment operations. A smaller portion comes from fees and property-related services, including management and ancillary resident income. UDR also periodically records gains tied to property sales or capital recycling, but those are not a stable operating revenue source and can cause earnings to swing from one period to another.
Based on the company’s business model and disclosures, the main economic sources of revenue can be summarized as follows:
- Apartment rental revenue: approximately 85% to 90% of total revenue. This includes base rent paid by residents across UDR’s multifamily portfolio.
- Other property income: approximately 10% to 15%. This usually includes items such as parking, utility reimbursements, application and service fees, and other resident-related income.
- Non-recurring gains and other items: typically 0% to 5% in a given year, but variable. These may include gains on asset sales or other transactions and should not be treated as recurring operating income.
Over the last several years, total revenue has continued to edge higher, rising from about $1.3 billion in 2021 to roughly $1.7 billion in 2025. At the same time, profitability has been less smooth because real estate companies can be heavily affected by financing costs, property sales, and non-cash valuation or depreciation-related effects. That makes UDR easier to understand as a cash-generating apartment owner than as a simple year-to-year earnings growth company.
The business mix points to a company with dependable recurring income, but also one whose results depend heavily on occupancy, rent growth, expense control, and the cost of debt. Revenue has grown steadily, while interest expense and other operating costs have remained important variables in how much of that revenue turns into bottom-line profit.
Key Figures
| Metric | Value | Sector ⓘ |
|---|---|---|
| Date | Oct 03, 2026 | |
| Context | ||
| Sector | Real Estate | |
| Industry | REIT - Residential | |
| Market Cap ⓘ | $12.33B | |
| Beta ⓘ | 0.69 | |
Value (Cheapness) | ||
| P/E Ratio ⓘ | 21.23 | 17.35 |
| P/B Ratio ⓘ | 5.38 | 0.86 |
| FCF Yield ⓘ | 7.48% | 7.47% |
| Dividend Yield ⓘ | 5.10% | 4.75% |
| EBIT / EV ⓘ | 3.85% | 3.81% |
| PEG ⓘ | 8.17 | |
Growth (Business expansion) | ||
| Revenue Growth ⓘ | -0.10% | 5.30% |
| RPS Growth (5Y CAGR) ⓘ | 4.86% | 5.96% |
| EPS Growth (5Y CAGR) ⓘ | 32.51% | -11.41% |
| BVPS Growth (5Y CAGR) ⓘ | -17.15% | 0.41% |
| Margin Growth (5Y Trend) ⓘ | -3.39% | 0.53% |
| FCF Growth (5Y CAGR) ⓘ | 5.40% | 5.40% |
| DPS Growth (5Y CAGR) ⓘ | 4.48% | 5.02% |
Quality (Business durability) | ||
| ROIC (Latest) ⓘ | 7.25% | 5.77% |
| ROE (Latest) ⓘ | 23.43% | 7.64% |
| ROA (Latest) ⓘ | 5.00% | 2.85% |
| ROIC (5Y Median) ⓘ | 4.07% | 4.20% |
| ROE (5Y Median) ⓘ | 3.33% | 6.03% |
| ROA (5Y Median) ⓘ | 1.47% | 2.45% |
| Net Debt / EBIT (Latest) ⓘ | 9.23 | 7.57 |
| Net Debt / EBIT (5Y Median) ⓘ | 16.07 | 8.41 |
| Net Debt / EBITDA (Latest) ⓘ | 4.54 | 5.12 |
| Net Debt / Assets ⓘ | 58.39% | 37.84% |
| EBITDA / Interest ⓘ | 6.71 | 4.11 |
| Operating Margin (Latest) ⓘ | 37.85% | 35.40% |
| Operating Margin (5Y Median) ⓘ | 23.63% | 36.59% |
| Debt to Equity (Latest) ⓘ | 204.00% | 89.06% |
| Profit Margin (Latest) ⓘ | 29.56% | 19.99% |
| Free Cash Flow (Latest) ⓘ | $921.61M | |
Momentum (Price trend) | ||
| 3Y Return ⓘ | +9.56% | +30.60% |
| 12M Return (excl. last month) ⓘ | -2.68% | +7.55% |
| 6M Return ⓘ | +0.75% | +0.69% |
| Price vs. 200-Day MA ⓘ | -7.55% | -2.30% |
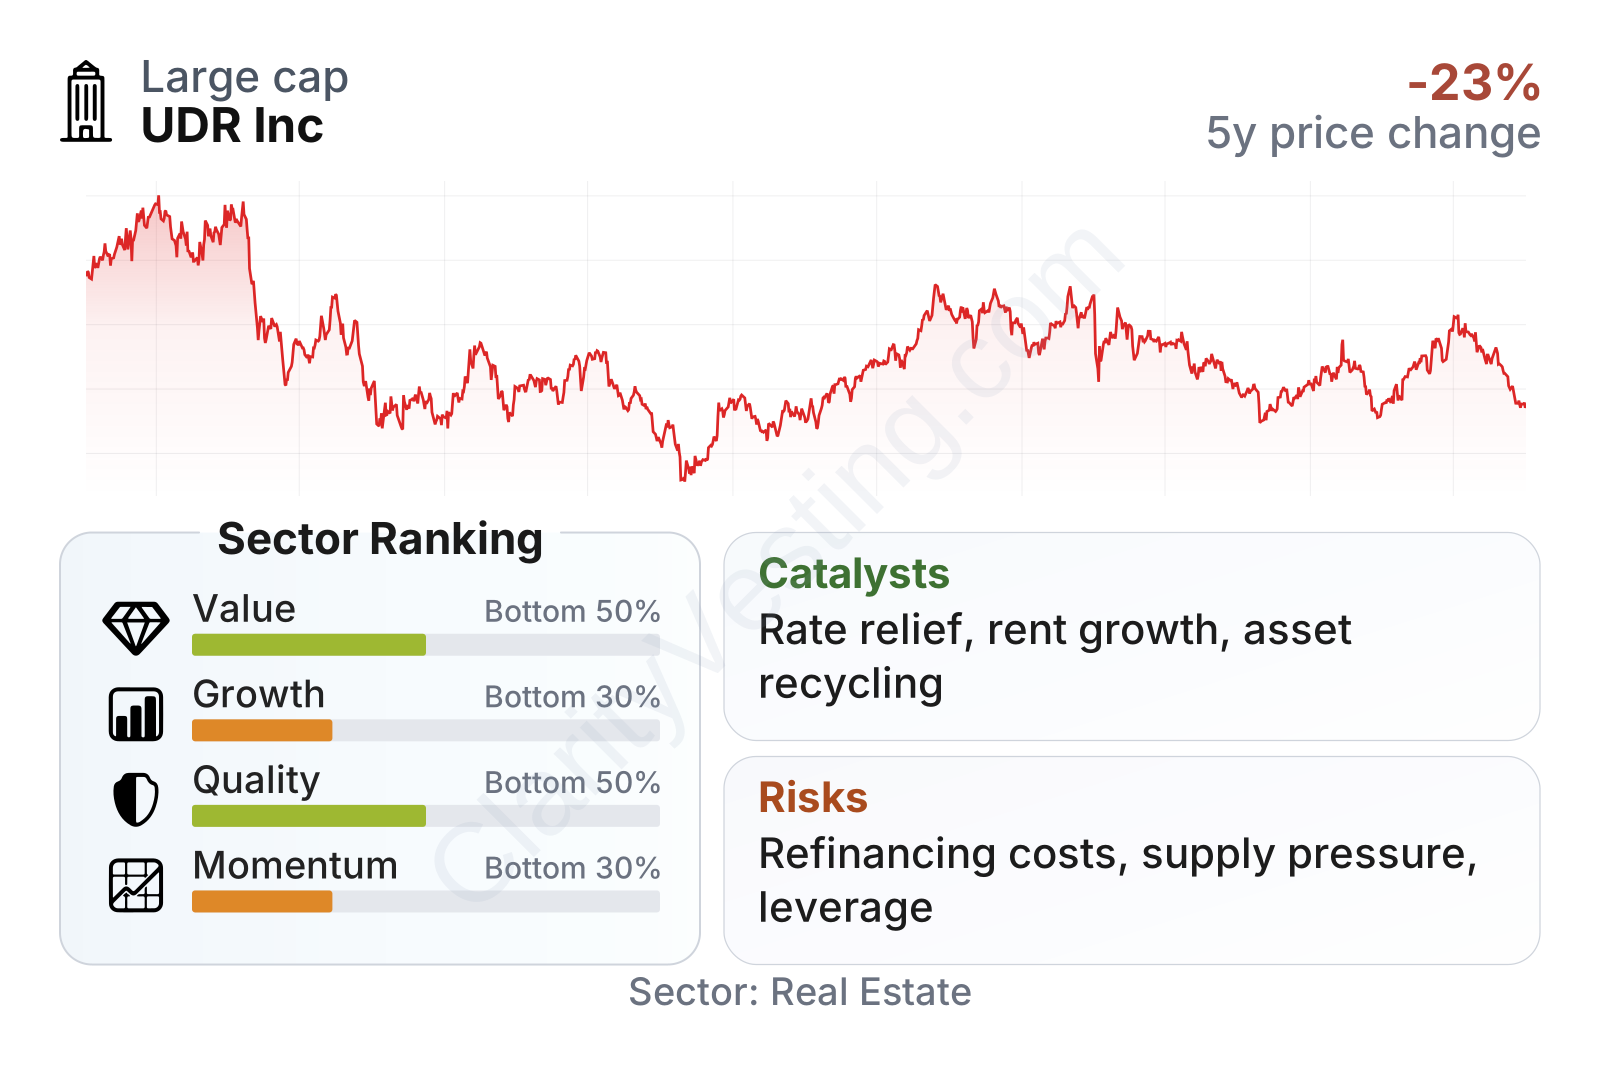
UDR is a large residential REIT with a market value in the low tens of billions of dollars and a below-market beta, which fits the profile of a relatively defensive real estate company. The overall factor picture is mixed. Value, quality, and momentum rank in the lower half of the sector, while growth ranks in the lower third. That said, some underlying metrics are stronger than those broad labels suggest: profitability margins, return on equity, return on assets, interest coverage, and free cash flow generation compare well with many peers. The weaker areas are revenue growth, book value trend, leverage relative to equity, and a valuation that sits above sector medians on common measures such as price-to-earnings and especially price-to-book.
The stock chart also reflects the interest-rate cycle that has shaped the REIT sector. Shares fell sharply from 2021 highs into 2022 and 2023, then recovered unevenly. More recently, the price has rebounded from early 2026 levels, but longer-term performance still trails the broader real estate peer group.
Growth
UDR operates in a sector with durable long-term demand. Housing is a basic need, and apartment rentals can benefit from high home prices, elevated mortgage rates, and lifestyle flexibility that keeps more households in the rental market. In many of the urban and suburban markets where UDR operates, land constraints and regulation can limit new housing supply, which can support occupancy and rents over time. That does not eliminate cyclical swings, but it gives well-positioned apartment owners a stronger long-range backdrop than many property categories.
The company’s strategy is sensible for that environment. UDR emphasizes established markets, portfolio management, redevelopment, and capital recycling rather than relying only on aggressive ground-up expansion. That matters because apartment REIT growth often comes from a combination of modest rent increases, high occupancy, operational efficiency, and selective buying, selling, or upgrading of properties. This is usually steadier than rapid expansion, even if it looks less exciting in a single year.
Revenue per share has trended upward consistently over the past five years, rising from a little above $4.25 to more than $5.15. That is a useful sign because it shows the company has expanded revenue on a per-share basis rather than relying entirely on issuing more shares. The pace has not been exceptional versus the sector, but it does show underlying business progress.
The dividend per share has also increased steadily, moving from roughly $1.45 in 2021 to around $1.73 in 2025. For a residential REIT, this is an important indicator of operating stability. The current trailing dividend yield is slightly above the sector median, which reflects both the income orientation of the business and the stock’s still-muted valuation backdrop after several years of rate pressure on REITs.
As for catalysts, the clearest one is the interest-rate environment. Apartment REITs are sensitive to bond yields and financing costs, so a more stable or easier rate setting can help both property values and stock valuations. Another support is UDR’s portfolio concentration in markets where rental demand can remain solid even during uneven economic periods. Continued rent growth, occupancy resilience, and disciplined capital allocation could gradually improve cash flow visibility. Recent company updates and filings have also highlighted ongoing portfolio optimization and balance-sheet management, which are important levers in a sector where funding costs can shape returns as much as rent growth does.
Risks
This article is for informational purposes only and does not constitute financial advice. Some content is AI-generated. See Disclaimer


