Stock Analysis · United Community Banks Inc (UCB)
Overview
United Community Banks Inc is a regional bank holding company based in the Southeast. Through its banking subsidiary, it provides traditional banking services for individuals, small businesses, commercial clients, and specialized lending niches. In simple terms, the company gathers deposits from customers, lends that money out at higher rates, earns fees from banking services, and tries to grow by adding customers in attractive local markets.
Its business is centered on community banking, but the revenue mix still matters because banks do not earn money the same way as industrial companies. Based on recent annual filings, the largest source of revenue is interest income from loans and investment securities, offset by the interest the bank pays on deposits and other funding. That leaves net interest income as the core earnings engine. Noninterest income adds a smaller but useful layer of diversification.
The main sources of revenue are approximately:
- Net interest income: about 75% to 85% of total revenue in a typical recent year. This includes income from commercial real estate loans, residential mortgage loans, construction lending, consumer lending, and securities, after subtracting interest paid on deposits and borrowings.
- Fee-based and other noninterest income: about 15% to 25%. This generally includes wealth management and trust fees, service charges and deposit-related fees, mortgage banking income, card and payment fees, and other banking service income.
That revenue mix shows a bank that is still mainly driven by spread income, meaning the gap between what it earns on loans and securities and what it pays to fund itself. For a regional bank, that is normal, but it also means profitability is highly sensitive to deposit pricing, credit quality, and interest-rate conditions.
The longer-term financial path has been uneven but constructive. Total revenue has increased strongly over the past several years, and earnings rebounded after the pressure seen in 2023. Operating expenses also grew, but net income recovered meaningfully by 2025, showing that the company has been able to absorb a tougher banking environment better than many feared.
The overall picture is one of a bank that has expanded revenue materially since 2021, went through a margin squeeze as funding costs rose, and then recovered part of that pressure as earnings improved.
Key Figures
| Metric | Value | Sector ⓘ |
|---|---|---|
| Date | Oct 17, 2026 | |
| Context | ||
| Sector | Financial Services | |
| Industry | Banks - Regional | |
| Market Cap ⓘ | $3.97B | |
| Beta ⓘ | 0.90 | |
Value (Cheapness) | ||
| P/E Ratio ⓘ | 10.84 | 12.26 |
| P/B Ratio ⓘ | 1.10 | 1.23 |
| FCF Yield ⓘ | 10.39% | 10.40% |
| Dividend Yield ⓘ | 3.00% | 3.02% |
| EBIT / EV ⓘ | 10.25% | 8.14% |
| PEG ⓘ | 1.67 | |
Growth (Business expansion) | ||
| Revenue Growth ⓘ | 24.40% | 9.35% |
| RPS Growth (5Y CAGR) ⓘ | 11.61% | 12.19% |
| EPS Growth (5Y CAGR) ⓘ | -15.58% | -9.53% |
| BVPS Growth (5Y CAGR) ⓘ | 4.31% | 4.99% |
| Margin Growth (5Y Trend) ⓘ | -21.07% | -3.86% |
| FCF Growth (5Y CAGR) ⓘ | 5.20% | 4.81% |
| DPS Growth (5Y CAGR) ⓘ | 4.83% | 8.79% |
Quality (Business durability) | ||
| ROIC (Latest) ⓘ | 9.12% | 9.49% |
| ROE (Latest) ⓘ | 10.13% | 13.90% |
| ROA (Latest) ⓘ | 1.32% | 1.55% |
| ROIC (5Y Median) ⓘ | N/A | 7.86% |
| ROE (5Y Median) ⓘ | 9.00% | 12.17% |
| ROA (5Y Median) ⓘ | 1.18% | 1.30% |
| Net Debt / EBIT (Latest) ⓘ | 0.53 | 0.96 |
| Net Debt / EBIT (5Y Median) ⓘ | -0.22 | 0.73 |
| Net Debt / EBITDA (Latest) ⓘ | 0.47 | 0.92 |
| Operating Margin (Latest) ⓘ | 30.70% | 22.30% |
| Operating Margin (5Y Median) ⓘ | 27.48% | 24.63% |
| Debt to Equity (Latest) ⓘ | 10.16% | 58.56% |
| Profit Margin (Latest) ⓘ | 34.09% | 26.57% |
| Free Cash Flow (Latest) ⓘ | $412.46M | |
Momentum (Price trend) | ||
| 3Y Return ⓘ | +46.45% | +88.33% |
| 12M Return (excl. last month) ⓘ | +14.96% | +19.38% |
| 6M Return ⓘ | +3.48% | +4.75% |
| Price vs. 200-Day MA ⓘ | +1.81% | +3.50% |
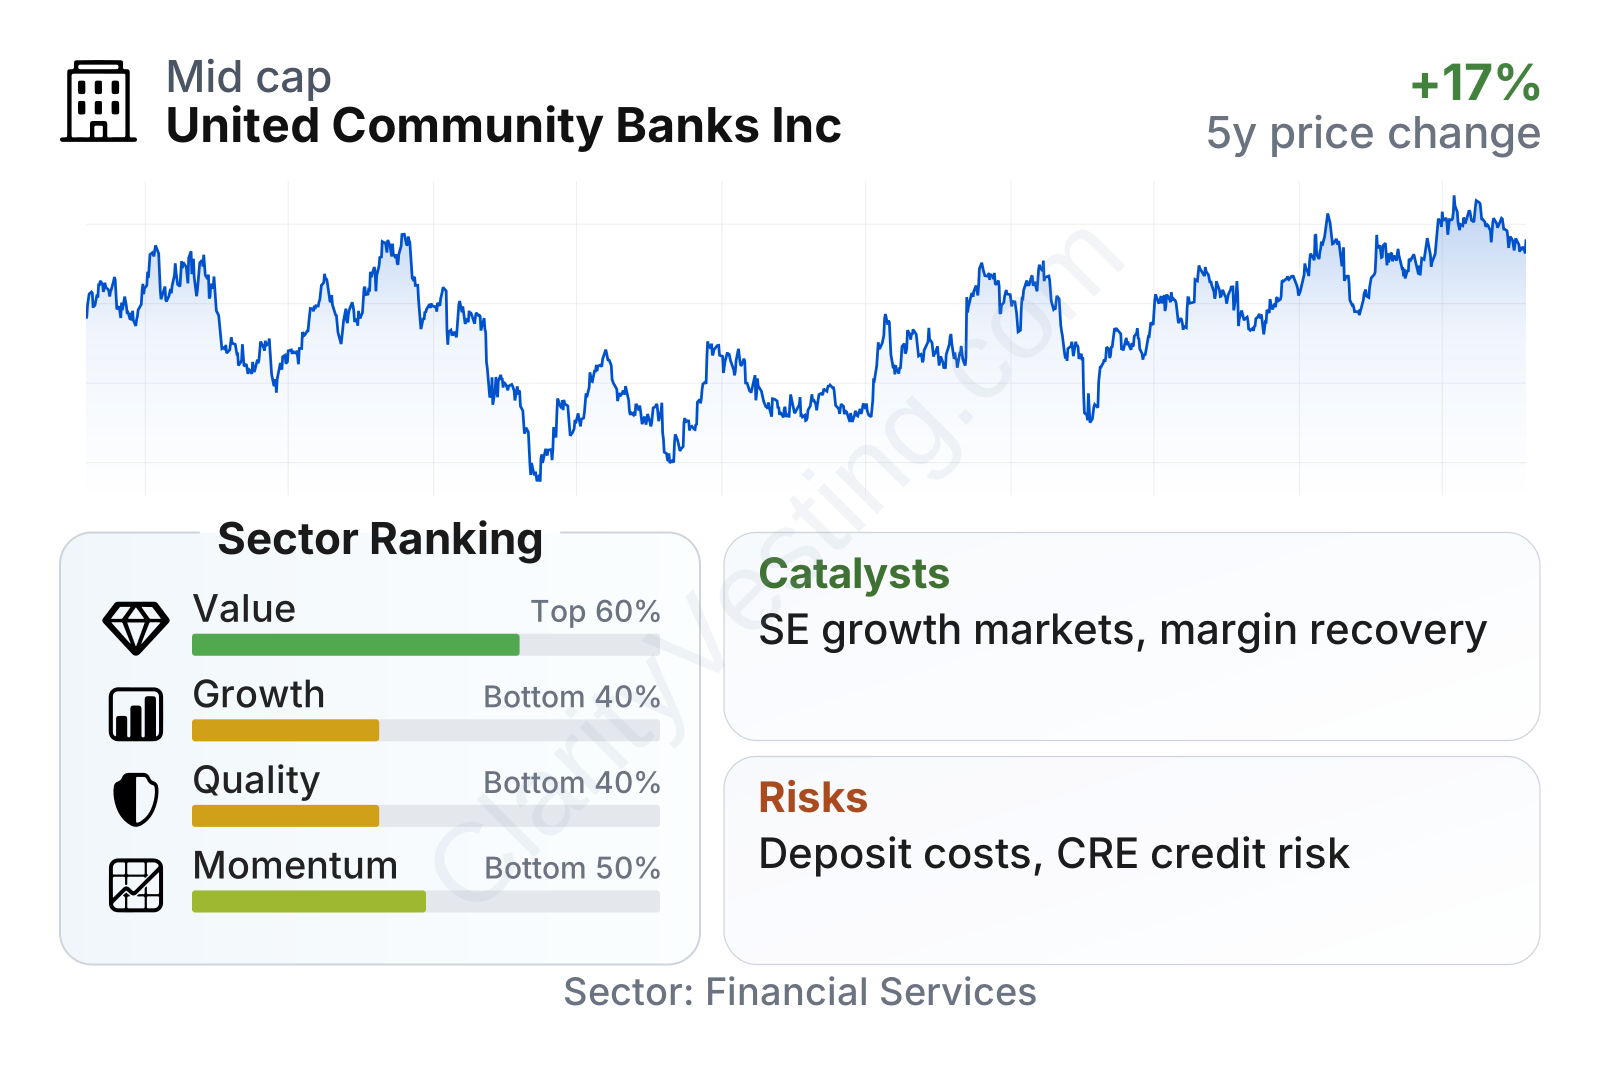
United Community Banks is a mid-sized regional bank with a market value around $4 billion and a stock volatility below the broader market, as shown by a beta under 1. On valuation, the shares trade at earnings and book multiples slightly below the sector median, while the dividend yield is roughly in line with peers at around 3%.
The table suggests a mixed profile. Value metrics look somewhat favorable versus the regional bank group, but growth, quality, and momentum rank in the lower part of the sector. Revenue growth has been strong recently, yet longer-term earnings growth and profitability have lagged peer medians. That combination usually points to a company that appears inexpensive on the surface but still needs to prove that improved revenue can translate into consistently better returns.
Growth
United Community Banks operates in a mature industry, so the main question is not whether banking itself is a high-growth sector, but whether this bank is positioned in markets and products that can outgrow the average regional lender. On that point, the answer is fairly encouraging. The company focuses on faster-growing Southeastern markets, where population growth, business formation, and migration trends have generally been stronger than the national average. That gives it a better backdrop than many banks located in slower-growth regions.
The strategy also makes practical sense. Management has combined organic expansion with acquisitions, and the bank has built exposure to commercial banking, mortgage, wealth management, and specialty lending. That broader platform can deepen customer relationships and reduce reliance on any one product line. For a regional bank, this is often one of the clearest ways to grow without taking outsized risk.
Earnings per share show why the market has remained somewhat cautious. Profitability fell from the stronger 2021 level, bottomed in 2023, and then began to recover through 2024 and 2025. That pattern is important because it suggests the company is not in a structural decline; instead, it has been working through an unfavorable rate and funding cycle.
Book value per share has moved steadily upward over the last several years. That matters for banks because book value is a rough indicator of the equity base supporting future lending and earnings. A rising book value per share, even if not exceptional versus peers, is usually a sign that capital has continued to build rather than erode.
One notable catalyst is the possibility of further margin normalization if deposit costs stabilize and loan yields remain supportive. Another is continued population and business growth in the bank’s footprint, which can support loan demand and deposit gathering. If management continues integrating past deals effectively and expands fee-based businesses, the company could produce steadier earnings quality than a pure spread lender.
Recent company updates have also pointed to ongoing balance-sheet repositioning and operating improvement efforts rather than emergency repair. That is not as dramatic as a transformational event, but for a regional bank, steady execution can be a meaningful growth driver when combined with stronger local markets.
Risks
This article is for informational purposes only and does not constitute financial advice. Some content is AI-generated. See Disclaimer


