Stock Analysis · UBS Group AG (UBS)
Overview
UBS Group AG is a global bank headquartered in Switzerland. After its takeover of Credit Suisse in 2023, UBS became an even larger player in wealth management, investment banking, asset management, and Swiss retail and corporate banking. Its business is centered on managing money for wealthy clients, advising institutions and corporations, making loans, handling deposits, and providing market and trading services.
For long-term analysis, the most important point is that UBS is not a simple deposit-taking bank. Its earnings come from several financial activities, with wealth management as the core franchise. Based on recent annual reporting, the revenue mix is approximately structured as follows:
- Global Wealth Management: about 40% to 45% of total revenue. This includes advisory fees, recurring mandates, lending to wealthy clients, deposits, and transaction income.
- Investment Bank: about 20% to 25%. This includes advisory on deals, underwriting, foreign exchange, equities, fixed income, and financing services.
- Personal & Corporate Banking: about 15% to 20%. This is the domestic Swiss bank serving individuals, small businesses, and corporations through loans, deposits, cards, and payments.
- Asset Management: about 10% to 15%. This covers investment funds and portfolio solutions for institutions, intermediaries, and private clients.
- Non-core and legacy items, plus group-related effects: a smaller and more variable share, generally under 10%, depending on integration and restructuring activity.
UBS now has a larger balance sheet, broader client base, and more opportunities to cross-sell products because of the Credit Suisse integration. That also means current results still reflect restructuring costs, capital usage, and changes in business mix rather than a fully stabilized post-merger picture.
The business has become much larger since the Credit Suisse acquisition, with revenue rising sharply from pre-deal levels. Profitability, however, has been uneven because integration expenses, funding costs, and restructuring charges have temporarily distorted the path from revenue to net income.
Key Figures
| Metric | Value | Sector ⓘ |
|---|---|---|
| Date | Oct 24, 2026 | |
| Context | ||
| Sector | Financial Services | |
| Industry | Banks - Diversified | |
| Market Cap ⓘ | $143.50B | |
| Beta ⓘ | 0.85 | |
Value (Cheapness) | ||
| P/E Ratio ⓘ | 15.94 | 12.46 |
| P/B Ratio ⓘ | 1.69 | 1.25 |
| FCF Yield ⓘ | 12.97% | 9.82% |
| Dividend Yield ⓘ | 2.30% | 2.94% |
| EBIT / EV ⓘ | 10.66% | 8.11% |
| PEG ⓘ | 0.68 | |
Growth (Business expansion) | ||
| Revenue Growth ⓘ | 14.60% | 9.10% |
| RPS Growth (5Y CAGR) ⓘ | 26.18% | 12.31% |
| EPS Growth (5Y CAGR) ⓘ | -5.39% | -6.97% |
| BVPS Growth (5Y CAGR) ⓘ | 15.39% | 5.02% |
| Margin Growth (5Y Trend) ⓘ | -12.76% | -4.00% |
| FCF Growth (5Y CAGR) ⓘ | -14.98% | 4.71% |
| DPS Growth (5Y CAGR) ⓘ | 20.39% | 8.92% |
Quality (Business durability) | ||
| ROIC (Latest) ⓘ | 3.30% | 9.18% |
| ROE (Latest) ⓘ | 10.67% | 13.93% |
| ROA (Latest) ⓘ | 0.57% | 1.57% |
| ROIC (5Y Median) ⓘ | 2.63% | 7.80% |
| ROE (5Y Median) ⓘ | 12.34% | 12.15% |
| ROA (5Y Median) ⓘ | 0.61% | 1.28% |
| Net Debt / EBIT (Latest) ⓘ | 8.85 | 1.02 |
| Net Debt / EBIT (5Y Median) ⓘ | 3.40 | 0.72 |
| Net Debt / EBITDA (Latest) ⓘ | 7.48 | 0.88 |
| Operating Margin (Latest) ⓘ | 23.50% | 22.30% |
| Operating Margin (5Y Median) ⓘ | 24.11% | 24.50% |
| Debt to Equity (Latest) ⓘ | 420.86% | 59.34% |
| Profit Margin (Latest) ⓘ | 17.95% | 26.42% |
| Free Cash Flow (Latest) ⓘ | $18.62B | |
Momentum (Price trend) | ||
| 3Y Return ⓘ | +121.87% | +95.73% |
| 12M Return (excl. last month) ⓘ | +19.09% | +17.30% |
| 6M Return ⓘ | +10.54% | +6.07% |
| Price vs. 200-Day MA ⓘ | +0.36% | +5.36% |
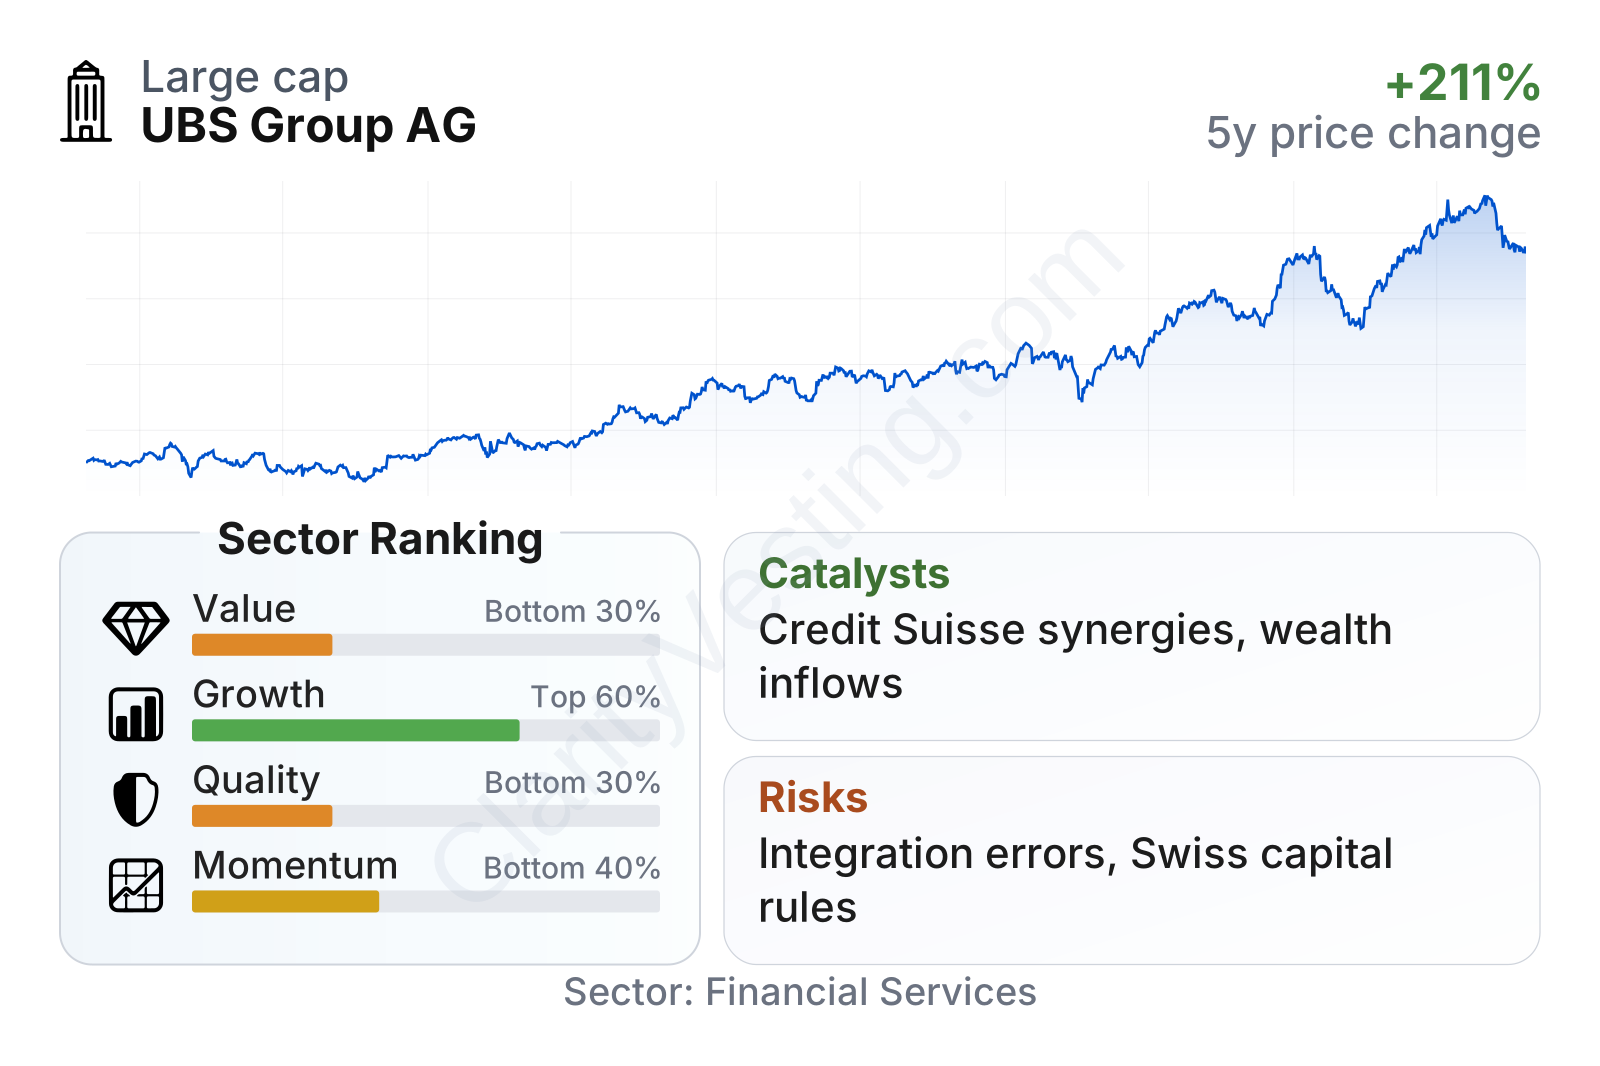
UBS is a very large financial institution with below-market share price volatility, which is notable for a global bank. On growth and market performance, it ranks in the upper half of the sector, helped by the post-acquisition expansion of the franchise and strong multi-year stock appreciation. On value and quality, the picture is less favorable: valuation multiples sit above sector medians, while returns on equity and assets remain below many peers as the group absorbs integration costs and carries a very large balance sheet.
The combination of decent revenue growth, strong book value growth, and weaker profitability metrics suggests a bank that has become bigger and strategically stronger, but has not yet fully converted that scale into consistently cleaner returns.
Growth
UBS operates in a sector that is mature overall, but some parts of it still have attractive long-term growth drivers. The best example is global wealth management, where growth is supported by rising personal wealth, cross-border asset allocation, retirement planning needs, and demand for advice in more complex markets. This is especially relevant for UBS because wealth management is its largest business and its clearest differentiator. The company also benefits from Switzerland’s role as a major international financial center and from a strong position in serving high-net-worth and ultra-high-net-worth clients.
The current strategy is straightforward: preserve the strength of the legacy UBS franchise, integrate Credit Suisse, reduce overlap, keep client assets in-house, and use the enlarged platform to improve margins over time. That logic makes industrial sense. Banking mergers often fail when they combine weak franchises or incompatible models. Here, UBS acquired scale in businesses it already understood well, especially in Swiss banking and global wealth management. The main question is not strategic fit, but execution.
Earnings per share have been volatile over the last several years, which is typical after a transformational acquisition. The negative result during the integration period was followed by a rebound, and the more recent direction is improving again. For long-term readers, this means current earnings should be viewed less as a steady run-rate and more as a business in transition toward a normalized post-merger level.
Book value per share has trended upward meaningfully over the period, especially after the balance-sheet effects of the Credit Suisse transaction. For a bank, this matters because book value is a key anchor for understanding financial strength and how much value is being retained inside the institution. Rising book value does not guarantee better future returns, but it does show that UBS now controls a much larger capital base and earnings platform.
The strongest catalyst is the integration itself. If UBS can keep client assets, cut duplicated costs, and avoid major revenue attrition, the earnings power of the combined group could look materially better than what current profitability ratios show. Additional support can come from higher activity in capital markets, stronger net interest income in Switzerland, and continued net new assets in wealth management. Company updates in 2025 and 2026 have continued to emphasize cost reductions, capital returns, and progress in simplifying the legacy Credit Suisse structure, all of which point to a multi-year opportunity rather than a one-quarter event.
Risks
This article is for informational purposes only and does not constitute financial advice. Some content is AI-generated. See Disclaimer


