Stock Analysis · United Airlines Holdings Inc (UAL)
Overview
United Airlines Holdings is one of the largest global airlines. Through its main subsidiary, United Airlines, the company transports passengers and cargo across North America, the Atlantic, the Pacific, and Latin America. Its network is built around major hubs such as Chicago, Denver, Houston, Newark, San Francisco, Washington D.C., Los Angeles, and Guam. In simple terms, United earns money by selling seats on flights, charging for related travel services, moving freight, and running a large loyalty program tied to travel and credit card spending.
Passenger revenue is by far the main engine of the business. In recent annual reporting, total revenue was a little above $57 billion, with most of that coming from passenger tickets and the rest from cargo and other activities. Based on company reporting, the revenue mix can be summarized approximately as follows:
- Passenger revenue: about 86% to 88% — ticket sales across domestic and international flights, including premium cabins and basic economy.
- Other operating revenue: about 9% to 11% — mainly loyalty program revenue, baggage fees, onboard services, and related commercial partnerships, especially co-branded card activity.
- Cargo revenue: about 2% to 4% — freight transportation on the airline’s network.
Geographically, United has a particularly important exposure to long-haul international travel compared with many U.S. peers. That matters because international routes, premium seating, and loyalty revenue often carry better economics than standard domestic leisure flying. The business has also become more profitable since the pandemic recovery period, with revenue rising from roughly $25 billion in 2021 to nearly $59 billion in 2025, while interest expense has trended lower and net income has turned solidly positive.
The multi-year picture shows a business that has largely moved past the recovery phase: revenue has expanded strongly, operating profit recovered from losses to several billion dollars, and financing costs have eased from post-pandemic highs. That said, airline economics remain highly cost-sensitive, so improvement in sales does not automatically translate into equally strong margin expansion.
Key Figures
| Metric | Value | Sector ⓘ |
|---|---|---|
| Date | Nov 01, 2026 | |
| Context | ||
| Sector | Industrials | |
| Industry | Airlines | |
| Market Cap ⓘ | $33.87B | |
| Beta ⓘ | 1.30 | |
Value (Cheapness) | ||
| P/E Ratio ⓘ | 9.55 | 21.83 |
| P/B Ratio ⓘ | 1.92 | 1.97 |
| FCF Yield ⓘ | 3.30% | 6.33% |
| Dividend Yield ⓘ | N/A | 1.88% |
| EBIT / EV ⓘ | 10.27% | 4.83% |
| PEG ⓘ | 4.86 | |
Growth (Business expansion) | ||
| Revenue Growth ⓘ | 17.40% | 9.50% |
| RPS Growth (5Y CAGR) ⓘ | 23.95% | 7.67% |
| EPS Growth (5Y CAGR) ⓘ | 25.25% | -11.52% |
| BVPS Growth (5Y CAGR) ⓘ | 31.51% | 6.14% |
| Margin Growth (5Y Trend) ⓘ | 11.76% | 0.71% |
| FCF Growth (5Y CAGR) ⓘ | N/A | 11.01% |
| DPS Growth (5Y CAGR) ⓘ | N/A | 9.31% |
Quality (Business durability) | ||
| ROIC (Latest) ⓘ | 10.35% | 10.63% |
| ROA (Latest) ⓘ | 4.43% | 5.41% |
| ROIC (5Y Median) ⓘ | 8.78% | 9.33% |
| ROA (5Y Median) ⓘ | 3.78% | 4.94% |
| Net Debt / EBIT (Latest) ⓘ | 5.03 | 2.03 |
| Net Debt / EBIT (5Y Median) ⓘ | 5.70 | 2.28 |
| Net Debt / EBITDA (Latest) ⓘ | 3.24 | 1.38 |
| Net Debt / Assets ⓘ | 32.48% | 19.16% |
| EBITDA / Interest ⓘ | 6.31 | 9.73 |
| Operating Margin (Latest) ⓘ | 8.38% | 10.49% |
| Operating Margin (5Y Median) ⓘ | 7.79% | 10.30% |
| Debt to Equity (Latest) ⓘ | 193.16% | 65.91% |
| Profit Margin (Latest) ⓘ | 5.46% | 6.61% |
| Free Cash Flow (Latest) ⓘ | $1.12B | |
Momentum (Price trend) | ||
| 3Y Return ⓘ | +197.74% | +69.18% |
| 12M Return (excl. last month) ⓘ | +14.97% | +12.04% |
| 6M Return ⓘ | +15.82% | +0.25% |
| Price vs. 200-Day MA ⓘ | -3.53% | +0.19% |
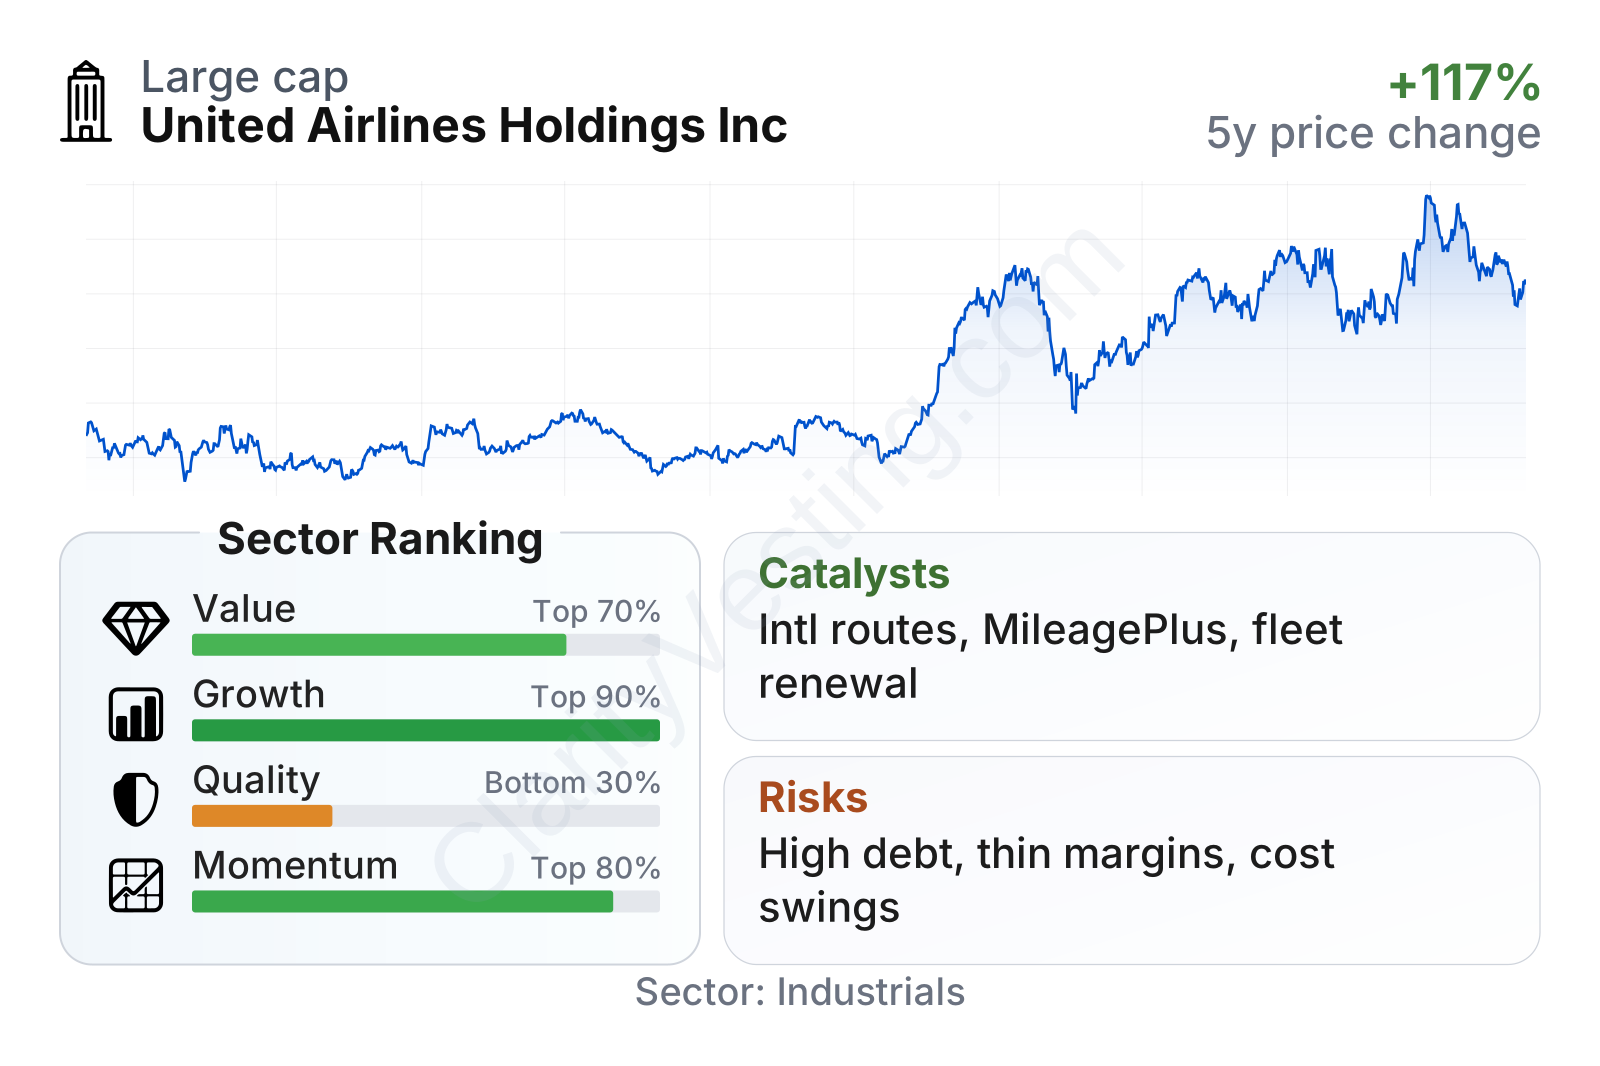
United stands out for growth and for valuation multiples that remain below much of the broader industrials universe. Revenue growth, revenue per share growth, earnings growth, and book value growth all rank well against the sector median. On the other hand, quality measures are weaker: profitability is positive but not best-in-class, and leverage remains notably higher than the sector norm. The stock’s recent history also shows meaningful volatility, which is common for airlines and reinforced here by a beta above 1.
Growth
Commercial aviation is a mature industry, but it still has attractive long-term growth drivers. Air travel tends to expand over time with GDP, rising international mobility, premium travel demand, and global tourism. Within that framework, United is positioned in one of the more attractive parts of the market because it has a strong international network and meaningful exposure to business and premium travelers. Those segments can support better unit revenue than purely domestic low-fare flying.
Management’s strategy has centered on growing capacity in places where United has network advantages, especially international and premium-heavy routes, while also refreshing the fleet and improving operational performance. The logic is straightforward: a denser and more modern network can improve customer appeal, fuel efficiency, and aircraft utilization over time. The company has also been investing in airport lounges, premium products, and digital tools, which support higher spending per traveler and reinforce loyalty program economics.
Recent revenue trends suggest that growth has normalized from the extreme rebound phase after the pandemic, but it remains healthy. Year-over-year growth surged in 2022 and 2023 as traffic recovered, then slowed as comparisons became tougher. More recently, the pace appears to have re-accelerated into the mid-teens range, which points to renewed demand strength rather than just recovery arithmetic.
Cash generation is another important part of the picture. Free cash flow has been positive overall but uneven, which is typical for airlines because aircraft spending and working capital can swing sharply from year to year. Even so, the company has recently produced cash flow in the low billions, which gives it more room to fund fleet investment and gradually reduce leverage.
A meaningful catalyst is United’s loyalty ecosystem. The MileagePlus program is more than a customer perk; it is a significant commercial asset because travel rewards partnerships, especially with credit card issuers, can generate recurring high-margin revenue. Another catalyst is international supply discipline. If long-haul demand remains firm while industry capacity grows at a measured pace, United’s route mix could remain favorable. Fleet modernization is also a visible medium-term driver because newer aircraft can lower fuel burn and maintenance intensity while supporting network expansion.
Recent company communications have also highlighted ongoing aircraft deliveries, premium seating expansion, and continued demand resilience in international and loyalty-related revenue streams. None of these alone changes the nature of the airline industry, but together they support the case that United’s earnings base is broader and stronger than it was a few years ago.
Risks
This article is for informational purposes only and does not constitute financial advice. Some content is AI-generated. See Disclaimer


