Stock Analysis · Tyra Biosciences Inc (TYRA)
Overview
Tyra Biosciences is a clinical-stage biotechnology company focused on precision medicines for cancer and certain genetic conditions. Its research is centered on the fibroblast growth factor receptor, or FGFR, family of proteins. These proteins can become abnormal in some tumors and rare diseases, and Tyra’s goal is to design highly selective drugs that block the altered target while limiting unwanted effects on healthy tissue.
The company is still in the development stage, so it does not yet have a commercial product generating recurring sales. Based on recent SEC filings, revenue is currently minimal and not driven by an established marketed therapy. In practical terms, the economic model today is built around spending on research to advance its pipeline rather than collecting product revenue.
Main sources of revenue are therefore extremely limited at this stage:
- Product revenue: approximately 0%. Tyra has no approved product on the market.
- Collaboration, licensing, or other operating revenue: currently not a meaningful contributor based on recent filings.
- Interest and other income: this is the main reported source of non-operating inflow today, coming from cash and short-term investments rather than from the core business.
What matters most for long-term analysis is therefore not current sales, but whether the pipeline can move from early clinical promise to later-stage proof, partnerships, regulatory progress, and eventually commercialization.
The cost structure reflects that reality. Over the past several years, research and development has represented the largest expense by far, and total operating costs have continued to rise as programs moved forward. That pattern is normal for a biotech company before approval, but it also means the business remains dependent on its cash reserves and capital markets until a drug reaches the market or a partner helps fund development.
The expense mix shows a company that is overwhelmingly research-driven. Research and development has consistently absorbed most spending, while administrative costs are much smaller. Revenue has remained near zero, so the widening losses mainly reflect a deliberate increase in pipeline investment rather than a deterioration of an existing commercial franchise.
Key Figures
| Metric | Value | Sector ⓘ |
|---|---|---|
| Date | Oct 17, 2026 | |
| Context | ||
| Sector | Healthcare | |
| Industry | Biotechnology | |
| Market Cap ⓘ | $1.29B | |
| Beta ⓘ | 0.75 | |
Value (Cheapness) | ||
| P/E Ratio ⓘ | N/A | 24.79 |
| P/B Ratio ⓘ | 3.55 | 3.08 |
| FCF Yield ⓘ | -8.55% | 3.15% |
| Dividend Yield ⓘ | N/A | 1.94% |
| EBIT / EV ⓘ | -11.90% | 0.57% |
| PEG ⓘ | N/A | |
Growth (Business expansion) | ||
| Revenue Growth ⓘ | N/A | 7.45% |
| RPS Growth (5Y CAGR) ⓘ | N/A | 8.61% |
| EPS Growth (5Y CAGR) ⓘ | N/A | -17.81% |
| BVPS Growth (5Y CAGR) ⓘ | -12.09% | 3.72% |
| Margin Growth (5Y Trend) ⓘ | N/A | -0.62% |
| FCF Growth (5Y CAGR) ⓘ | N/A | 1.04% |
| DPS Growth (5Y CAGR) ⓘ | N/A | 6.77% |
Quality (Business durability) | ||
| ROIC (Latest) ⓘ | -36.19% | 3.24% |
| ROA (Latest) ⓘ | -43.36% | 3.01% |
| ROIC (5Y Median) ⓘ | -23.34% | 4.60% |
| ROA (5Y Median) ⓘ | -28.10% | 1.89% |
| Net Debt / EBIT (Latest) ⓘ | N/A | 1.34 |
| Net Debt / EBIT (5Y Median) ⓘ | N/A | 1.84 |
| Net Debt / EBITDA (Latest) ⓘ | N/A | 1.00 |
| Net Debt / Assets ⓘ | -17.80% | 5.45% |
| EBITDA / Interest ⓘ | N/A | 9.64 |
| Operating Margin (Latest) ⓘ | N/A | 9.27% |
| Operating Margin (5Y Median) ⓘ | N/A | 7.38% |
| Debt to Equity (Latest) ⓘ | 1.58% | 28.58% |
| Profit Margin (Latest) ⓘ | N/A | 3.59% |
| Free Cash Flow (Latest) ⓘ | -$109.90M | |
Momentum (Price trend) | ||
| 3Y Return ⓘ | +29.17% | +42.80% |
| 12M Return (excl. last month) ⓘ | +106.58% | +18.50% |
| 6M Return ⓘ | -45.55% | +7.57% |
| Price vs. 200-Day MA ⓘ | -37.12% | +5.12% |
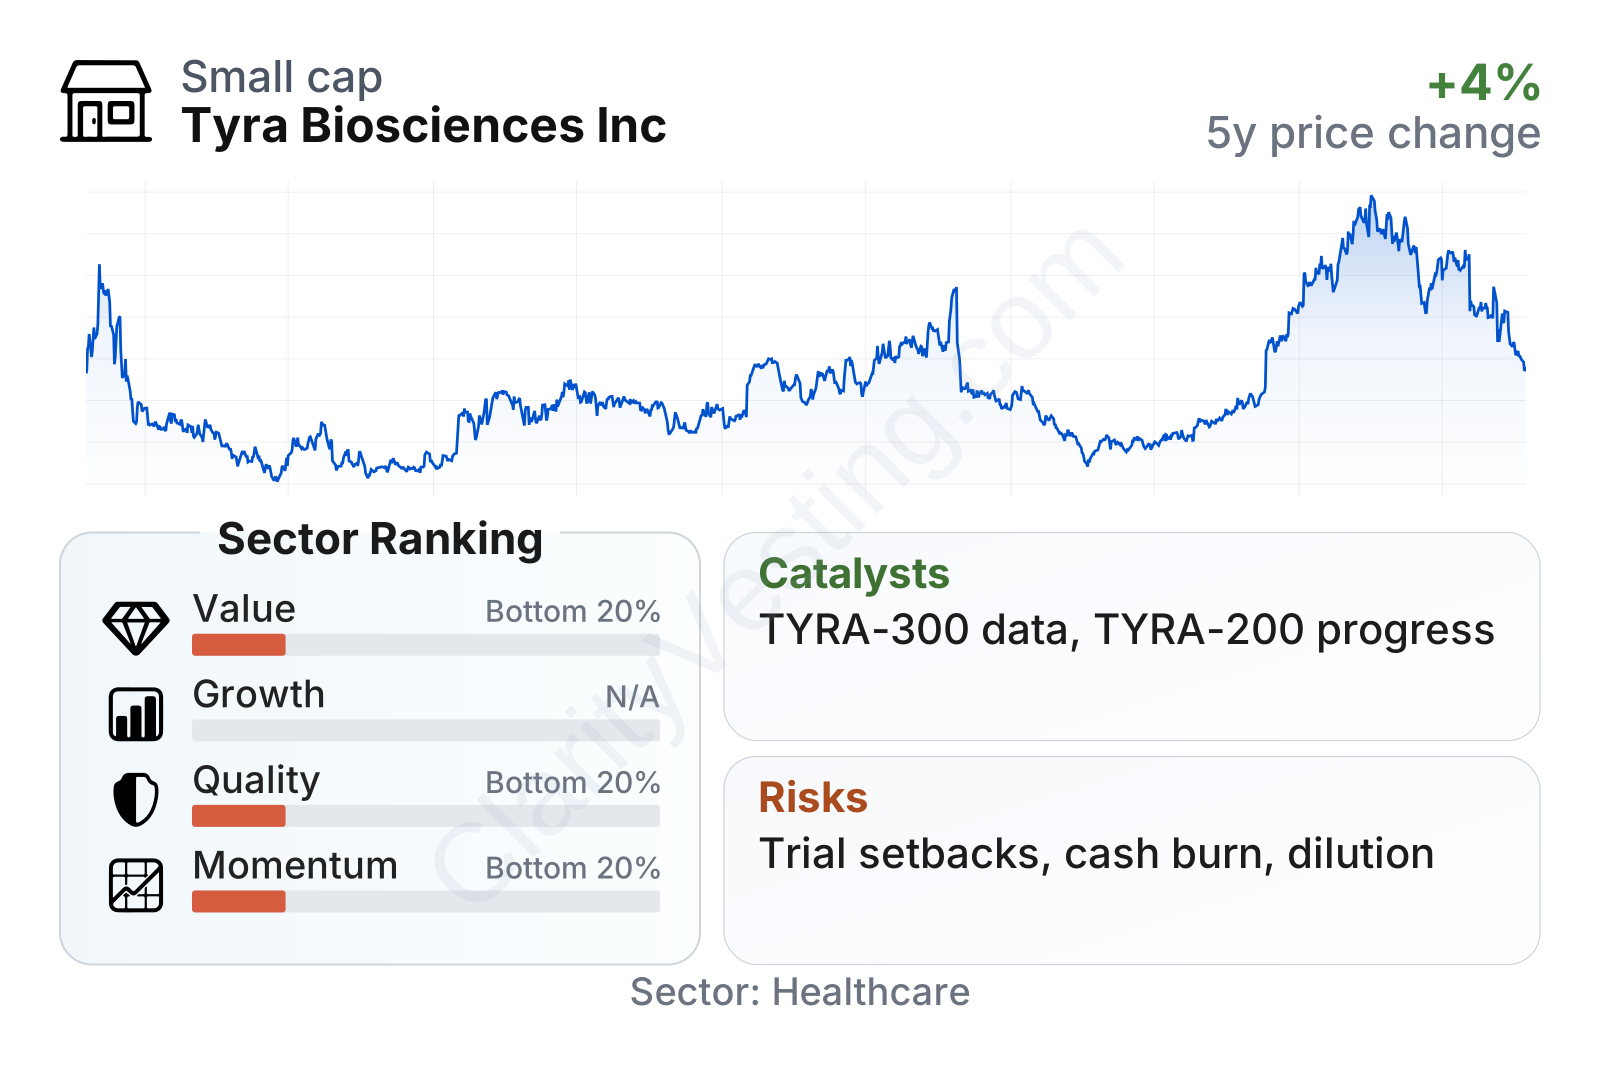
Tyra is a small-cap biotech with a market value around the mid-$1 billion range, which places it in a size category where clinical updates can have an outsized effect on valuation. The factor profile is weak on value and quality, which is typical for a pre-revenue drug developer: profitability is absent, free cash flow is negative, and traditional earnings-based measures are not very useful. Momentum has been mixed. The stock has delivered a strong multi-year gain and a sharp rebound over the last year, but more recent trading has been volatile and remains below its longer-term trend line.
Growth
Tyra operates in a part of healthcare that can produce very large long-term outcomes if a medicine works: targeted oncology and precision medicine. This remains an attractive area because modern cancer treatment increasingly depends on matching a drug to a specific mutation or biological pathway. If a company can show strong efficacy in a defined patient group, even a niche drug can become medically important and commercially meaningful.
Tyra’s strategy is logically built around selectivity. In simple terms, the company is trying to make drugs that hit the intended abnormal FGFR target more precisely than older approaches. That matters because better selectivity can potentially improve the balance between benefit and side effects, which is often a key issue in targeted cancer drugs. The company’s lead programs include TYRA-300 and TYRA-200, and recent development updates have kept attention on how these candidates may perform in tumors driven by FGFR alterations.
One important catalyst for a company like this is clinical data, especially in patient groups where current treatment options are limited or where existing FGFR inhibitors have known tolerability constraints. Another potential catalyst is expansion into additional tumor types or genetically defined indications, which can broaden the addressable market without requiring an entirely new drug platform.
Recent company updates have highlighted continued advancement of its clinical pipeline, including enrollment and data milestones for lead programs. For long-term analysis, the most significant opportunity is straightforward: if Tyra can show durable and differentiated clinical results in a targeted population, it could move from being valued mainly on scientific potential to being valued on a clearer development and commercial path.
Cash generation is moving in the opposite direction of operating progress, which is common in clinical-stage biotech. Free cash outflow has become more negative over time as development activity has expanded. That does not invalidate the growth case, but it means pipeline progress needs to continue at a pace that justifies the rising cash burn.
Risks
This article is for informational purposes only and does not constitute financial advice. Some content is AI-generated. See Disclaimer


