Stock Analysis · Tortoise Energy Infrastructure Closed Fund (TYG)
Overview
Tortoise Energy Infrastructure Closed Fund is a closed-end fund rather than an operating energy company. Its job is to invest shareholder capital in a portfolio of energy infrastructure businesses, with a strong focus on the North American midstream segment. In simple terms, it gives public-market exposure to companies that own and operate the systems that move, store, process, and handle oil, natural gas, natural gas liquids, and related products. These assets often include pipelines, storage terminals, gathering systems, and processing facilities.
The fund is managed by Tortoise Capital and is organized to generate a high level of distributions while also seeking total return over time. Because it is a closed-end fund, its share price can move differently from the value of the portfolio it owns. That is an important point for long-term readers: owning TYG means owning an investment vehicle that holds energy infrastructure securities, not directly owning one operating pipeline company.
Its economic drivers are different from those of a typical industrial business. Based on fund disclosures and the way closed-end funds report results, the main sources of investment income are generally:
- Cash distributions and dividends from portfolio holdings: typically the largest recurring source of cash received by the fund, coming mainly from midstream corporations and MLP-related energy infrastructure issuers.
- Net realized gains on investments: gains created when portfolio positions are sold above their carrying value; this can be meaningful in strong energy markets but is much less predictable than portfolio income.
- Net change in unrealized appreciation or depreciation: the mark-to-market movement in the value of holdings; this can dominate reported earnings in some years, but it does not represent recurring cash income.
- Other income, if any: small items such as interest on cash balances or related investment activity.
Portfolio-level reporting indicates the fund remains concentrated in energy infrastructure, especially companies tied to pipeline and midstream cash flows. That means TYG’s long-term results are shaped primarily by the health of U.S. energy volumes, capital discipline across the midstream industry, and valuation changes in listed infrastructure securities.
The income statement has been highly volatile across recent years, which is normal for a market-valued investment fund. Reported revenue and net income have swung sharply because accounting results include changes in portfolio valuations, not just recurring cash income. At the same time, operating costs have stayed small relative to asset value, which is helpful because it means most of the economic result comes from portfolio performance rather than a heavy expense base.
A useful takeaway from the business flow is that reported profitability can jump or drop dramatically from one year to the next as portfolio values move. That makes headline earnings less informative than asset value, portfolio quality, distributions received from holdings, and the discount or premium between TYG’s share price and its underlying net asset value.
Key Figures
| Metric | Value | Sector ⓘ |
|---|---|---|
| Date | Oct 17, 2026 | |
| Context | ||
| Sector | Financial Services | |
| Industry | Asset Management | |
| Market Cap ⓘ | $967.99M | |
| Beta ⓘ | 0.74 | |
Value (Cheapness) | ||
| P/E Ratio ⓘ | 5.25 | 12.26 |
| P/B Ratio ⓘ | 0.81 | 1.23 |
| FCF Yield ⓘ | 8.77% | 10.40% |
| Dividend Yield ⓘ | 13.65% | 3.02% |
| EBIT / EV ⓘ | N/A | 8.14% |
| PEG ⓘ | N/A | |
Growth (Business expansion) | ||
| Revenue Growth ⓘ | -2.90% | 9.35% |
| RPS Growth (5Y CAGR) ⓘ | -53.81% | 12.19% |
| EPS Growth (5Y CAGR) ⓘ | N/A | -9.53% |
| BVPS Growth (5Y CAGR) ⓘ | 7.95% | 4.99% |
| Margin Growth (5Y Trend) ⓘ | 343.89% | -3.86% |
| FCF Growth (5Y CAGR) ⓘ | 11.58% | 4.81% |
| DPS Growth (5Y CAGR) ⓘ | 26.86% | 8.79% |
Quality (Business durability) | ||
| ROIC (Latest) ⓘ | N/A | 9.49% |
| ROE (Latest) ⓘ | 29.35% | 13.90% |
| ROA (Latest) ⓘ | 22.05% | 1.55% |
| ROIC (5Y Median) ⓘ | 10.40% | 7.86% |
| ROE (5Y Median) ⓘ | 23.97% | 12.17% |
| ROA (5Y Median) ⓘ | 17.32% | 1.30% |
| Net Debt / EBIT (Latest) ⓘ | N/A | 0.96 |
| Net Debt / EBIT (5Y Median) ⓘ | 0.91 | 0.73 |
| Net Debt / EBITDA (Latest) ⓘ | 2.11 | 0.92 |
| Operating Margin (Latest) ⓘ | N/A | 22.30% |
| Operating Margin (5Y Median) ⓘ | 100.25% | 24.63% |
| Debt to Equity (Latest) ⓘ | 36.22% | 58.56% |
| Profit Margin (Latest) ⓘ | 562.11% | 26.57% |
| Free Cash Flow (Latest) ⓘ | $84.86M | |
Momentum (Price trend) | ||
| 3Y Return ⓘ | +90.32% | +88.33% |
| 12M Return (excl. last month) ⓘ | +15.13% | +19.38% |
| 6M Return ⓘ | -12.74% | +4.75% |
| Price vs. 200-Day MA ⓘ | -10.67% | +3.50% |
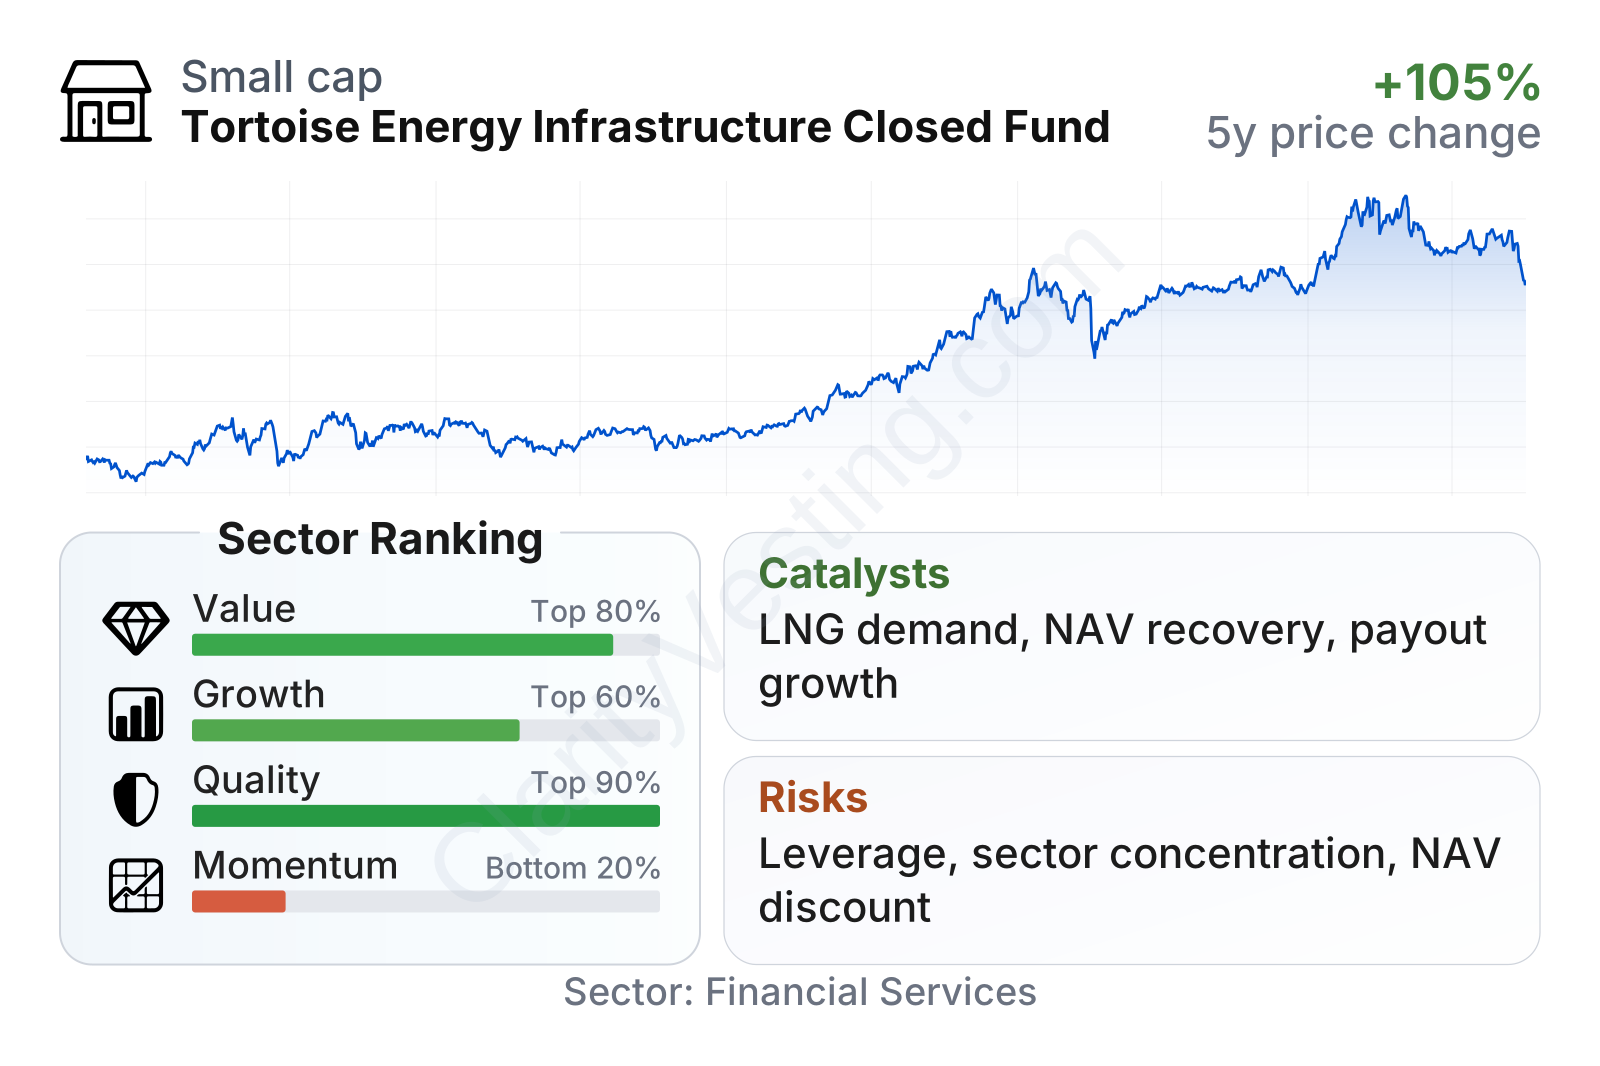
TYG is a mid-sized closed-end fund in market value terms, with a beta below 1, which suggests it has historically moved somewhat less than the broader stock market. The factor profile is unusual in a good way on some points and weaker on others: value metrics look inexpensive versus the broader Financial Services sector, quality metrics rank very high, growth sits around the middle of the pack, and recent momentum has been soft. The very high trailing distribution yield stands out immediately, but for a fund like TYG that number should be read together with portfolio performance and net asset value trends rather than in isolation.
The share price has climbed strongly over the last several years despite noticeable pullbacks along the way. That pattern fits the underlying sector: energy infrastructure recovered sharply after a weak period, then continued to benefit from stronger balance sheets, stable fee-based cash flows, and renewed interest in income-producing assets.
Growth
TYG operates in a part of the energy market that still has room for growth, even though it is not a classic high-growth industry. North American energy infrastructure benefits from long-lived demand for pipelines, storage, processing, and export-related assets. Natural gas and natural gas liquids remain especially important because they connect directly to power generation, industrial demand, LNG exports, and petrochemical use. That backdrop supports the fund’s strategy of owning listed infrastructure companies whose earnings often depend more on volumes and contracted fees than on commodity prices alone.
Its strategy also makes sense in the current market structure. Many midstream companies have become more disciplined over the last several years: they have lowered leverage, improved shareholder payouts, and reduced the kind of aggressive expansion spending that used to destroy returns. For TYG, that matters because a healthier midstream industry can translate into stronger distributions from holdings, better portfolio stability, and room for net asset value growth over time.
Earnings per share have been highly uneven, which is common for a fund whose accounting results include market-value changes. A better sign for long-term business progress is that book value per share has trended upward overall across the last five years despite setbacks. That suggests the portfolio has created value over time even though annual reported profits have been choppy.
Book value per share growth of roughly 8% annualized over five years is better than the sector median in the supplied metrics, and dividend per share growth has also been strong. Free cash flow growth and margin trends also compare well with the broader sector. Even with a recent year-over-year revenue decline, those signals point to a fund that has participated in an improving industry backdrop and has been able to translate that into stronger shareholder economics over a multi-year period.
One important catalyst is continued U.S. natural gas infrastructure demand, especially from LNG export growth and power-related demand. Another is the possibility that income-oriented market attention returns to listed infrastructure and closed-end funds after a weak momentum stretch. If portfolio holdings continue raising dividends or repurchasing shares, TYG can benefit indirectly through higher cash receipts and stronger asset valuations.
Recent company communications have also emphasized distribution levels and portfolio positioning in energy infrastructure. For a fund like TYG, any sustained recovery in midstream equity valuations or narrowing of the discount to net asset value can be a meaningful opportunity, because returns can come from both the underlying portfolio and the market price investors assign to the fund itself.
Risks
This article is for informational purposes only and does not constitute financial advice. Some content is AI-generated. See Disclaimer


