Stock Analysis · Tri Continental Closed Fund (TY)
Overview
Tri-Continental Corporation is one of the oldest closed-end funds in the U.S. Rather than operating a traditional business that sells products or services, it invests shareholder capital in a portfolio of publicly traded companies. The fund is managed by Columbia Management Investment Advisers and its objective is long-term growth of capital together with current income. In simple terms, shareholders are buying exposure to a diversified stock portfolio run by a professional manager.
Its economic engine is different from that of an operating company. Revenue mainly comes from gains and income produced by the investment portfolio, so reported results can swing sharply with market conditions.
- Net realized and unrealized investment gains: typically the largest driver over time, coming from changes in the value of stocks held and profits or losses when securities are sold.
- Dividend income from portfolio holdings: cash distributions received from the underlying companies owned by the fund.
- Interest and other investment income: a smaller contribution, usually linked to cash balances, short-term instruments, or other portfolio-related income sources.
Because this is a closed-end fund, another important feature is that its market price can differ from the value of its underlying holdings, known as net asset value. That discount or premium can materially shape shareholder returns in addition to portfolio performance.
The income profile has been highly market-driven: results were very strong in 2021, turned negative during the 2022 market drawdown, then recovered in 2023 and 2024. Operating costs remained very small relative to total assets and portfolio income, which is typical for an investment fund structure.
Key Figures
| Metric | Value | Sector ⓘ |
|---|---|---|
| Date | Oct 17, 2026 | |
| Context | ||
| Sector | Financial Services | |
| Industry | Asset Management | |
| Market Cap ⓘ | $1.84B | |
| Beta ⓘ | 0.85 | |
Value (Cheapness) | ||
| P/E Ratio ⓘ | 5.48 | 12.26 |
| P/B Ratio ⓘ | 0.89 | 1.23 |
| FCF Yield ⓘ | 6.74% | 10.40% |
| Dividend Yield ⓘ | 3.18% | 3.02% |
| EBIT / EV ⓘ | N/A | 8.14% |
| PEG ⓘ | N/A | |
Growth (Business expansion) | ||
| Revenue Growth ⓘ | 2.70% | 9.35% |
| RPS Growth (5Y CAGR) ⓘ | -16.82% | 12.19% |
| EPS Growth (5Y CAGR) ⓘ | -26.46% | -9.53% |
| BVPS Growth (5Y CAGR) ⓘ | -0.22% | 4.99% |
| Margin Growth (5Y Trend) ⓘ | 23.33% | -3.86% |
| FCF Growth (5Y CAGR) ⓘ | N/A | 4.81% |
| DPS Growth (5Y CAGR) ⓘ | 41.05% | 8.79% |
Quality (Business durability) | ||
| ROIC (Latest) ⓘ | N/A | 9.49% |
| ROE (Latest) ⓘ | 28.12% | 13.90% |
| ROA (Latest) ⓘ | 28.03% | 1.55% |
| ROIC (5Y Median) ⓘ | N/A | 7.86% |
| ROE (5Y Median) ⓘ | 15.05% | 12.17% |
| ROA (5Y Median) ⓘ | 15.02% | 1.30% |
| Net Debt / EBIT (Latest) ⓘ | N/A | 0.96 |
| Net Debt / EBIT (5Y Median) ⓘ | N/A | 0.73 |
| Net Debt / EBITDA (Latest) ⓘ | -0.00 | 0.92 |
| Operating Margin (Latest) ⓘ | N/A | 22.30% |
| Operating Margin (5Y Median) ⓘ | 100.28% | 24.63% |
| Debt to Equity (Latest) ⓘ | N/A | 58.56% |
| Profit Margin (Latest) ⓘ | 481.18% | 26.57% |
| Free Cash Flow (Latest) ⓘ | $124.22M | |
Momentum (Price trend) | ||
| 3Y Return ⓘ | +45.98% | +88.33% |
| 12M Return (excl. last month) ⓘ | +6.94% | +19.38% |
| 6M Return ⓘ | +6.04% | +4.75% |
| Price vs. 200-Day MA ⓘ | +3.50% | +3.50% |
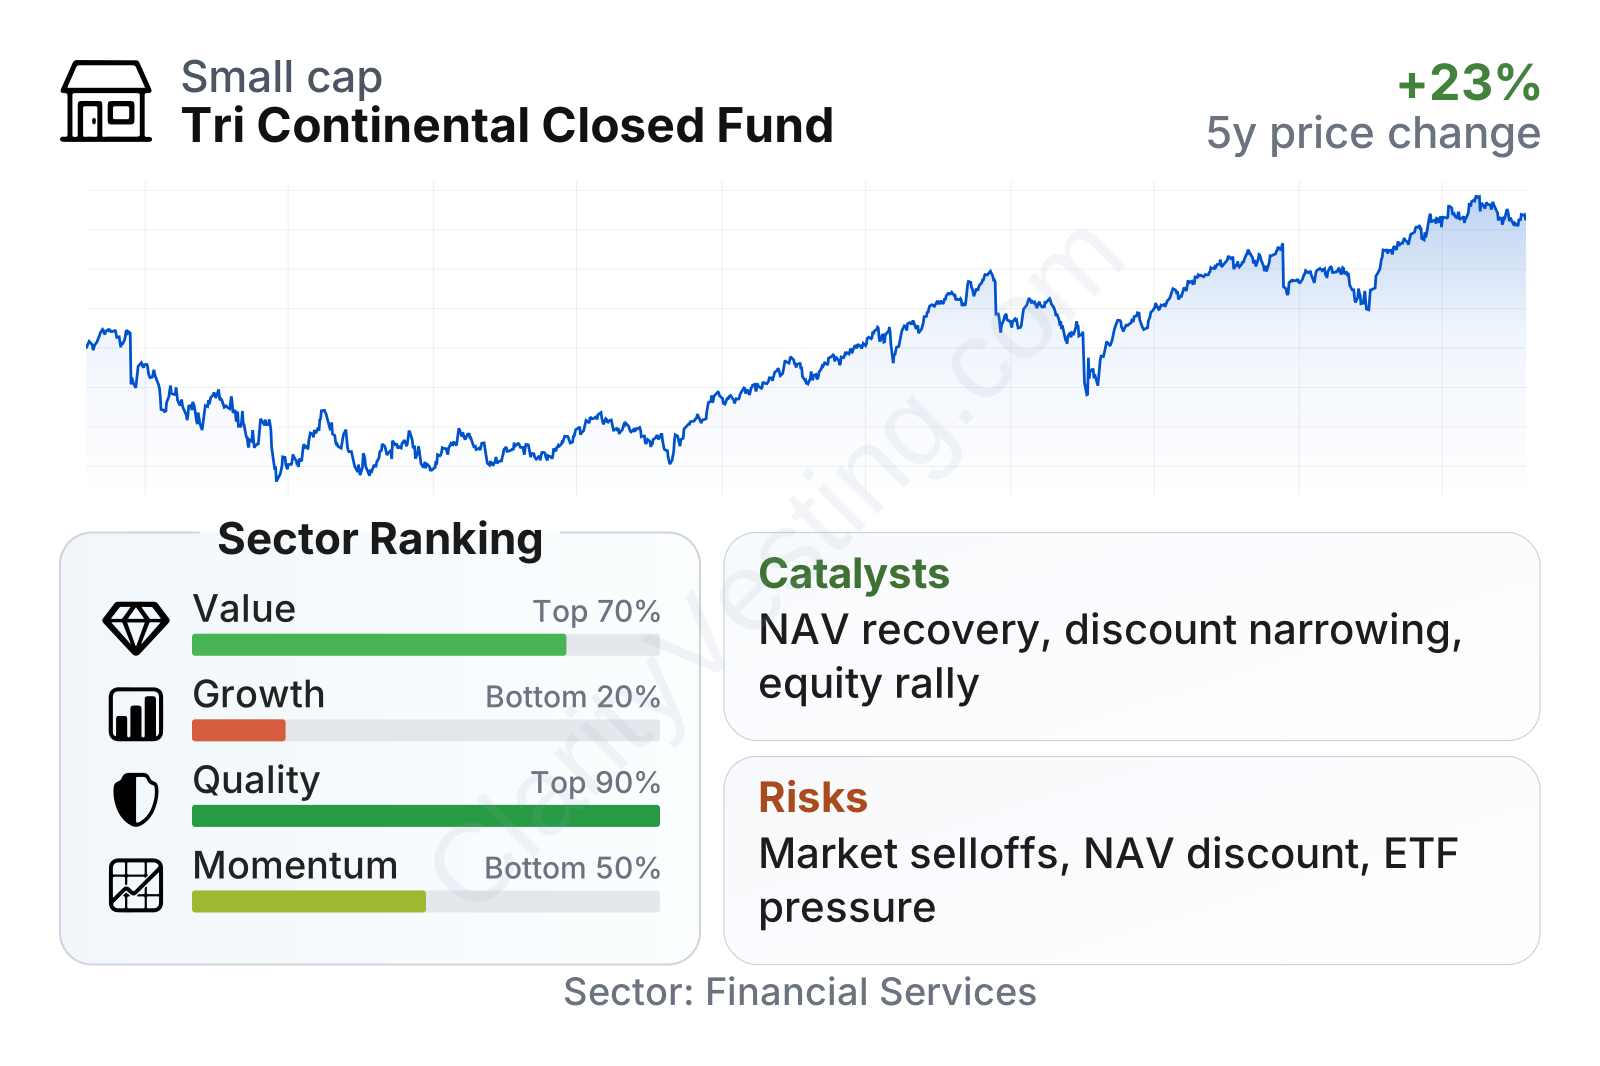
Tri-Continental sits in the mid-sized range and shows a mixed profile. Valuation measures look lower than much of the Financial Services sector, with both earnings and book-based multiples below sector medians. Quality metrics appear unusually strong, reflecting very high reported profitability and very low balance-sheet strain, while growth indicators are much weaker, largely because closed-end fund results depend on market cycles rather than steady operating expansion. Share-price momentum has improved recently, but longer-term performance still trails the broader sector median.
The stock-price path also shows this pattern clearly: after a sharp decline in 2022, the shares recovered through 2024, went through volatility in 2025, and reached new highs in 2026. For a vehicle like TY, those moves should be read alongside changes in net asset value and the discount to net asset value, not only as a judgment on business execution.
Growth
Tri-Continental operates in a durable sector because long-term demand for professionally managed equity exposure has not disappeared. However, this is not a high-growth business in the usual sense. The fund’s future depends more on the strength of U.S. equity markets, portfolio selection, and the fund’s ability to preserve and grow net asset value over time than on opening new markets or launching new products.
The strategy remains logical for a long-term vehicle: it provides diversified exposure to U.S. companies and is designed for capital appreciation with income support. The main catalyst is straightforward. If equity markets remain constructive and the portfolio’s holdings perform well, TY’s net asset value can rise and support both market-price performance and distribution capacity. A second potential catalyst is discount behavior. Closed-end funds sometimes see stronger share performance when the gap between market price and net asset value narrows.
Earnings have been volatile, which is normal for an investment fund whose reported income includes market gains and losses. The rebound after the 2022 loss-making period shows how sensitive reported profit is to broader market conditions. That makes TY less of a compounding operating business and more of a market-linked capital allocation vehicle.
Book value per share, a very important measure for this type of company, has largely recovered from the 2022 decline and moved back toward prior levels by 2024 and 2025. That recovery matters because book value is a close proxy for the underlying portfolio value. Recent annual and semiannual filings also show continued positioning in large-cap U.S. equities, which keeps the fund aligned with parts of the market that remain central to long-term wealth creation.
Risks
This article is for informational purposes only and does not constitute financial advice. Some content is AI-generated. See Disclaimer


