Stock Analysis · Textron Inc (TXT)
Overview
Textron Inc. is a diversified aerospace and defense manufacturer. The company is best known for Cessna and Beechcraft aircraft, Bell helicopters and tiltrotor aircraft, specialized vehicles such as golf carts and utility vehicles, and a defense unit that produces products including military vehicles, marine craft, and unmanned systems. Its business is spread across commercial aviation, military aviation, industrial products, and finance.
Based on Textron’s latest annual reporting, revenue is mainly generated by the following operating segments, listed from largest to smallest:
- Textron Aviation: about 39% of revenue. This includes business jets, turboprop aircraft, piston aircraft, military trainer and defense aviation products, aftermarket parts, and maintenance services.
- Bell: about 24% of revenue. This covers military and commercial helicopters, tiltrotor programs, and support services.
- Industrial: about 24% of revenue. This segment includes specialized vehicles under brands such as E-Z-GO and Arctic Cat, along with fuel systems and functional components.
- Textron Systems: about 9% of revenue. This business serves defense and government customers with products such as unmanned aircraft, marine systems, precision weapons, and armored or tactical solutions.
- Finance: about 4% of revenue. This unit mainly provides financing for aircraft and other Textron products.
That mix matters because it gives Textron more than one engine of demand. Business aviation, military rotorcraft, and industrial vehicles do not move in perfect sync, which can help smooth results over time. At the same time, it also means the company must execute well across several very different markets.
Over the last several years, revenue has trended upward overall, while profitability has been more uneven. Sales moved from roughly $12.4 billion in 2021 to about $14.8 billion in 2025, and operating income also improved over that stretch. However, margins did not rise in a straight line, showing that growth has depended not only on demand but also on product mix, costs, and program execution.
Key Figures
| Metric | Value | Sector ⓘ |
|---|---|---|
| Date | Oct 03, 2026 | |
| Context | ||
| Sector | Industrials | |
| Industry | Aerospace & Defense | |
| Market Cap ⓘ | $13.35B | |
| Beta ⓘ | 0.90 | |
Value (Cheapness) | ||
| P/E Ratio ⓘ | 14.56 | 22.45 |
| P/B Ratio ⓘ | 1.63 | 1.98 |
| FCF Yield ⓘ | 5.68% | 6.31% |
| Dividend Yield ⓘ | 0.10% | 1.96% |
| EBIT / EV ⓘ | 8.31% | 4.81% |
| PEG ⓘ | 0.90 | |
Growth (Business expansion) | ||
| Revenue Growth ⓘ | 3.00% | 9.10% |
| RPS Growth (5Y CAGR) ⓘ | 10.70% | 7.75% |
| EPS Growth (5Y CAGR) ⓘ | -6.88% | -13.59% |
| BVPS Growth (5Y CAGR) ⓘ | 9.77% | 6.22% |
| Margin Growth (5Y Trend) ⓘ | 0.34% | 0.72% |
| FCF Growth (5Y CAGR) ⓘ | 18.32% | 10.98% |
| DPS Growth (5Y CAGR) ⓘ | 7.32% | 9.48% |
Quality (Business durability) | ||
| ROIC (Latest) ⓘ | 8.85% | 10.92% |
| ROA (Latest) ⓘ | 5.28% | 5.41% |
| ROIC (5Y Median) ⓘ | 9.10% | 9.21% |
| ROA (5Y Median) ⓘ | 5.27% | 4.94% |
| Net Debt / EBIT (Latest) ⓘ | 1.72 | 2.07 |
| Net Debt / EBIT (5Y Median) ⓘ | 1.78 | 2.28 |
| Net Debt / EBITDA (Latest) ⓘ | 1.31 | 1.43 |
| Net Debt / Assets ⓘ | 12.13% | 19.27% |
| EBITDA / Interest ⓘ | 16.15 | 9.53 |
| Operating Margin (Latest) ⓘ | 8.37% | 10.50% |
| Operating Margin (5Y Median) ⓘ | 8.51% | 10.27% |
| Debt to Equity (Latest) ⓘ | 47.24% | 65.48% |
| Profit Margin (Latest) ⓘ | 6.13% | 6.62% |
| Free Cash Flow (Latest) ⓘ | $759.00M | |
Momentum (Price trend) | ||
| 3Y Return ⓘ | -2.20% | +58.56% |
| 12M Return (excl. last month) ⓘ | +0.59% | +15.63% |
| 6M Return ⓘ | -12.93% | +4.19% |
| Price vs. 200-Day MA ⓘ | -15.02% | +0.93% |
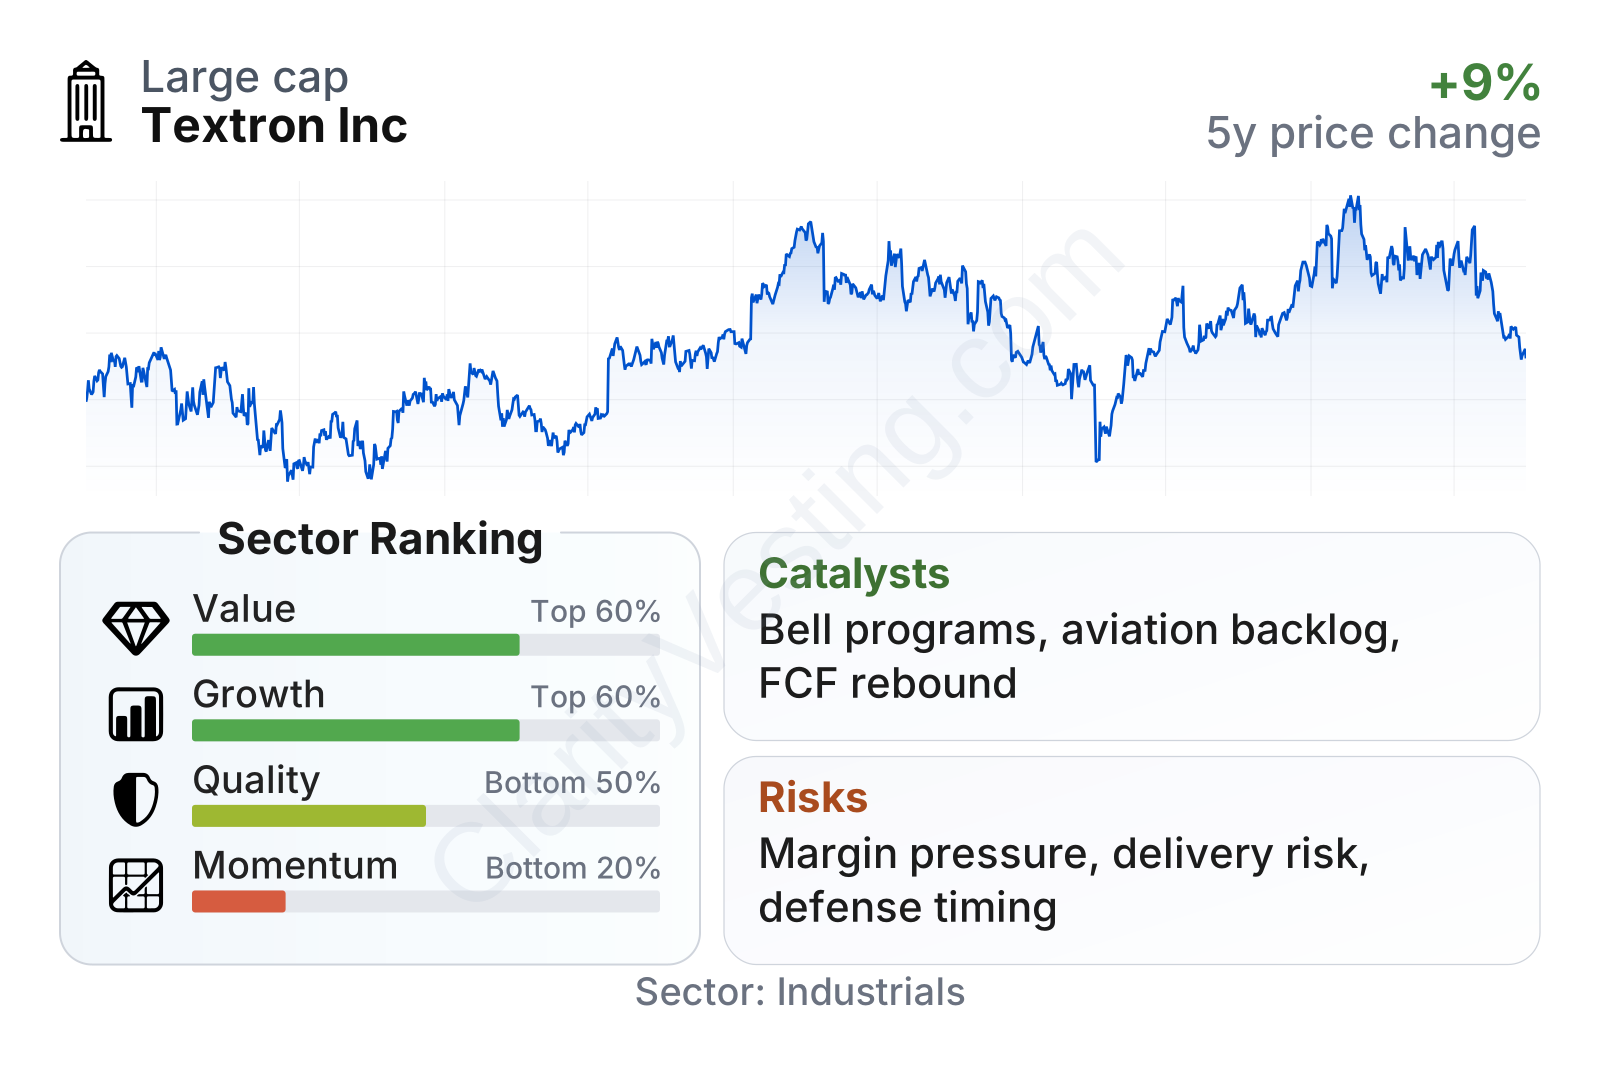
Textron sits in the large mid-cap range, with a stock price history that has been volatile but generally stronger than its 2022 lows. The broader profile is mixed: valuation measures look relatively moderate versus much of the aerospace and defense sector, growth is decent rather than exceptional, balance-sheet leverage is controlled, while profitability and recent share-price momentum trail many industry peers.
Growth
Textron operates in markets that have long-term support, especially business aviation and defense aerospace. In business jets and turboprop aircraft, replacement demand, pilot training needs, and fleet modernization continue to support the industry. In defense, military customers remain focused on vertical lift, autonomous systems, and modernization programs. These are favorable categories, but they are not uniformly high-growth every year; they tend to move with procurement cycles, customer budgets, and delivery timing.
Textron’s strategy is sensible for long-term expansion because it combines established franchises with selective newer opportunities. Textron Aviation gives the company a large installed base that can generate recurring aftermarket revenue. Bell provides exposure to military aviation programs, including future vertical lift opportunities. Textron Systems adds optionality in unmanned and advanced defense technologies, while the industrial unit offers more everyday commercial demand than pure aerospace companies usually have.
Recent revenue growth has been positive but somewhat inconsistent. The latest year-over-year pace is around 3%, below the sector median, yet the longer five-year revenue-per-share trend is better than the industry median. That suggests Textron has been able to compound its business over time, even if near-term comparisons have not always been strong.
Cash generation is an important part of the case. Free cash flow has been uneven from year to year, but the longer-term trend is still constructive, with five-year free-cash-flow growth running well ahead of the sector median. The latest trailing figure remains substantial, which matters because aerospace manufacturers often need cash discipline to manage inventory, product development, and cyclical swings in deliveries.
A meaningful catalyst is Bell’s role in next-generation military aircraft programs and Textron’s broader defense technology exposure. Another is continued normalization in aircraft deliveries and aftermarket activity at Textron Aviation. If production execution improves and demand stays healthy, those businesses can support both revenue growth and margin recovery. Recent company updates have also highlighted ongoing order activity and backlog support across parts of the portfolio, which is important for visibility in long-cycle manufacturing businesses.
Risks
This article is for informational purposes only and does not constitute financial advice. Some content is AI-generated. See Disclaimer


