Stock Analysis · Twist Bioscience Corp (TWST)
Overview
Twist Bioscience is a biotechnology tools company that uses a semiconductor-style manufacturing process to write DNA at scale. In simple terms, it makes custom synthetic DNA that researchers and companies use to discover drugs, design diagnostic tests, develop biologic medicines, and build new products in life sciences. The company has also expanded beyond DNA synthesis into antibody discovery and, more recently, into next-generation DNA data storage technology. Its business model is built around being a supplier to other research and healthcare organizations rather than developing most end products on its own.
The company’s revenue is mainly generated from a few clearly identified operating lines. Based on recent company reporting, the mix is approximately:
- Synthetic biology products: about 70% to 75% of revenue. This includes genes, oligo pools, variant libraries, and other custom DNA products used by biotech, pharma, academic, and industrial customers.
- NGS tools: about 15% to 20% of revenue. This includes target enrichment panels and related products used in sequencing workflows, especially in research and clinical applications.
- Biopharma services: about 10% to 15% of revenue. This mainly comes from antibody discovery and other services provided to drug developers, supported in part by the Abveris acquisition.
- Other and emerging activities: currently a very small share of revenue, including early-stage DNA data storage programs and certain non-core items.
Twist’s revenue base has broadened over time. Synthetic biology remains the core engine, but management has been pushing higher-value applications such as therapeutic antibody discovery and regulated sequencing tools, which could improve customer stickiness and long-term margins if execution remains solid.
The income profile has also been improving. Revenue has risen strongly over the last several years, gross profit has expanded faster than cost of revenue, and annual losses have narrowed sharply from the peak loss years. The main pressure point is operating expense, especially selling, general, and administrative costs, which still absorb a large share of gross profit.
The broad financial flow shows a business that is scaling well at the gross profit level, with losses shrinking meaningfully by fiscal 2025. That is encouraging, but the path to durable profitability still depends on keeping expense growth below revenue growth.
Key Figures
| Metric | Value | Sector ⓘ |
|---|---|---|
| Date | Oct 03, 2026 | |
| Context | ||
| Sector | Healthcare | |
| Industry | Biotechnology | |
| Market Cap ⓘ | $12.81B | |
| Beta ⓘ | 2.22 | |
Value (Cheapness) | ||
| P/E Ratio ⓘ | N/A | 24.06 |
| P/B Ratio ⓘ | 26.33 | 3.08 |
| FCF Yield ⓘ | -0.73% | 3.07% |
| Dividend Yield ⓘ | N/A | 2.05% |
| EBIT / EV ⓘ | -1.28% | 0.63% |
| PEG ⓘ | N/A | |
Growth (Business expansion) | ||
| Revenue Growth ⓘ | 23.20% | 7.50% |
| RPS Growth (5Y CAGR) ⓘ | 23.09% | 8.70% |
| EPS Growth (5Y CAGR) ⓘ | -20.08% | -18.20% |
| BVPS Growth (5Y CAGR) ⓘ | -9.97% | 3.95% |
| Margin Growth (5Y Trend) ⓘ | N/A | -0.58% |
| FCF Growth (5Y CAGR) ⓘ | -14.16% | 0.88% |
| DPS Growth (5Y CAGR) ⓘ | N/A | 6.80% |
Quality (Business durability) | ||
| ROIC (Latest) ⓘ | -22.71% | 3.29% |
| ROA (Latest) ⓘ | -20.80% | 3.02% |
| ROIC (5Y Median) ⓘ | -29.62% | 4.75% |
| ROA (5Y Median) ⓘ | -26.19% | 1.93% |
| Net Debt / EBIT (Latest) ⓘ | N/A | 1.33 |
| Net Debt / EBIT (5Y Median) ⓘ | N/A | 1.83 |
| Net Debt / EBITDA (Latest) ⓘ | N/A | 0.99 |
| Net Debt / Assets ⓘ | -3.55% | 5.33% |
| EBITDA / Interest ⓘ | N/A | 9.63 |
| Operating Margin (Latest) ⓘ | -30.84% | 9.25% |
| Operating Margin (5Y Median) ⓘ | -83.01% | 7.80% |
| Debt to Equity (Latest) ⓘ | 21.00% | 28.99% |
| Profit Margin (Latest) ⓘ | -31.66% | 3.60% |
| Free Cash Flow (Latest) ⓘ | -$93.12M | |
Momentum (Price trend) | ||
| 3Y Return ⓘ | +880.96% | +37.48% |
| 12M Return (excl. last month) ⓘ | +389.66% | +20.85% |
| 6M Return ⓘ | +279.59% | +9.73% |
| Price vs. 200-Day MA ⓘ | +146.56% | +4.69% |
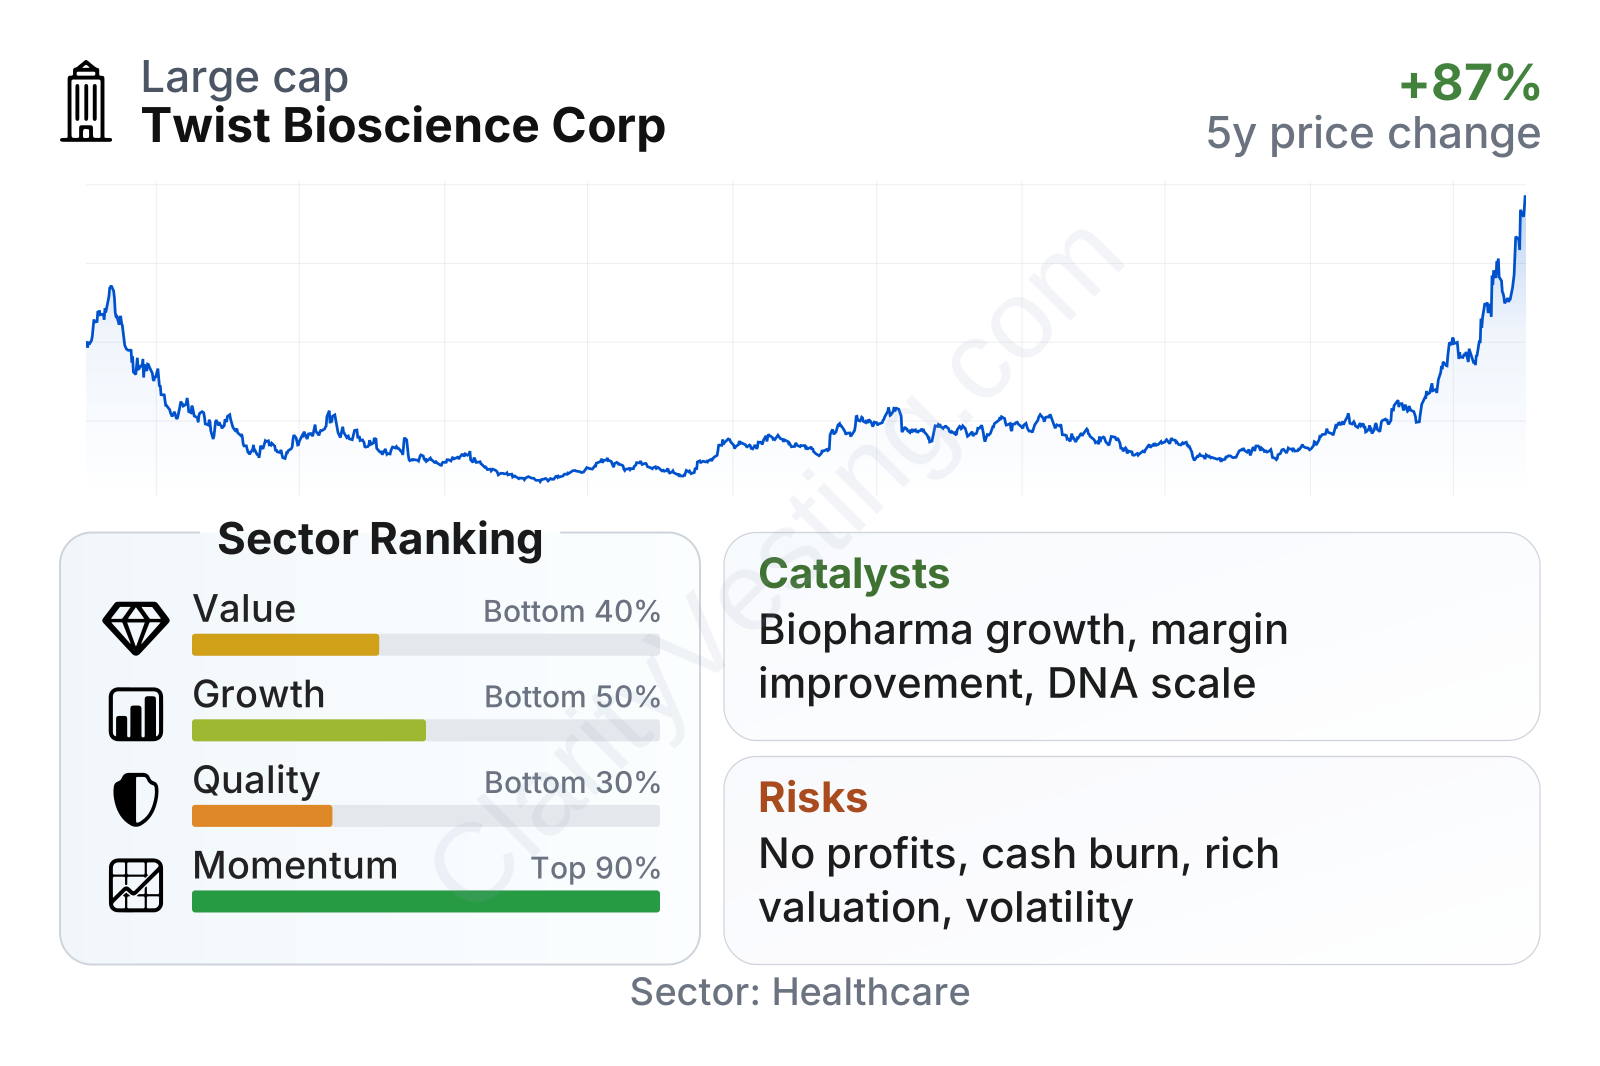
Twist stands out for market momentum rather than classic value or profitability measures. The stock has been extremely volatile over the last several years, with a major drawdown followed by a powerful recovery into 2026. Relative to the healthcare sector, the company ranks strongly on price performance, but its valuation multiples remain elevated and its quality metrics are still weak because earnings, returns on capital, and free cash flow are negative.
The factor picture is mixed. Growth in revenue is clearly stronger than the sector median, but that advantage is offset by below-median profitability and expensive balance-sheet-adjusted valuation measures. In other words, the market is putting a large value on future scale and margin improvement rather than on current earnings power.
Growth
Twist operates in a sector with long-term structural demand behind it. Synthetic biology, genomics, biologics discovery, and research automation are all areas benefiting from lower sequencing costs, the wider use of AI in drug discovery, and continued investment in precision medicine. A company that can deliver DNA quickly, accurately, and at scale has a useful position in that ecosystem.
Its strategy for future expansion is coherent. The base business in synthetic DNA creates recurring demand from a broad customer set, while the company’s push into antibody discovery and sequencing tools gives it access to larger customer budgets and more specialized workflows. That matters because commodity-like DNA production alone may not justify premium margins forever; adding higher-value services and applications can make the platform more defensible.
Recent revenue growth has stayed comfortably above the sector median, even though the pace is lower than the very high post-pandemic expansion period. That suggests the business is moving from hypergrowth toward a more mature but still healthy expansion phase. A growth rate in the high teens to low twenties is still strong for a company at Twist’s current size, especially when it is paired with better gross profit conversion.
Cash generation remains the main unfinished part of the growth case. Free cash flow has improved substantially from earlier lows, but it is still negative and has shown some recent pressure again. For a long-term view, the key issue is whether higher revenue can continue to convert into lower cash burn without slowing commercial momentum.
There are also meaningful catalysts. The company has highlighted progress in its antibody discovery business, continued uptake in synthetic biology, and advances in DNA data storage through collaboration programs. Another important catalyst is the broader pharmaceutical industry’s focus on biologics and AI-assisted discovery, which can increase demand for large and rapid DNA library production. If Twist keeps improving manufacturing efficiency while deepening relationships with larger pharmaceutical customers, the addressable opportunity could widen further.
Recent company communications have also pointed to operational progress rather than merely scientific ambition: stronger revenue, improving gross margin, and substantially narrower losses. For a company that was once viewed mainly as a high-potential but cash-burning platform, that shift is meaningful.
Risks
This article is for informational purposes only and does not constitute financial advice. Some content is AI-generated. See Disclaimer