Stock Analysis · Tradeweb Markets Inc (TW)
Overview
Tradeweb Markets Inc operates electronic marketplaces used by institutional, wholesale, retail, and corporate clients to trade financial instruments. In simple terms, it is a technology-driven trading network that helps large market participants buy and sell bonds, interest-rate products, exchange-traded funds, money markets, and some equities more efficiently. The company earns money by providing access to these marketplaces, processing transactions, and offering workflow and data-related tools around trading.
Its business is diversified across several client channels and asset classes, which matters because trading activity can shift from one market to another depending on interest rates, volatility, and regulation. Tradeweb has built a strong position in electronic fixed-income trading, an area that has been steadily moving away from voice-based and manual processes toward digital execution.
Based on company disclosures, Tradeweb’s main revenue sources come from transaction fees and related recurring activity across key product areas. Approximate revenue mix by product area is as follows:
- Rates: about 40% to 45% of revenue. This includes U.S. government bonds, European government bonds, mortgages, swaps, and futures-related trading activity.
- Credit: about 25% to 30%. This covers corporate bonds, municipal bonds, and credit derivatives.
- Money Markets: about 15% to 20%. This includes repurchase agreements, money market instruments, and short-term funding products.
- Equities: about 5% to 10%. This mainly includes ETFs and certain cash equity trading activity.
- Market Data and Other: about 5% to 10%. This includes data, connectivity, and other platform-related services.
Another useful way to view the business is by customer channel. Institutional clients are the largest contributor, followed by wholesale, with smaller contributions from retail and corporates. That mix reflects Tradeweb’s historic strength with large professional market participants.
The company has also shown notable operating leverage. Revenue has increased strongly over the last several years, while profit has expanded even faster, indicating that additional trading volume can scale well once the platform and client network are in place.
The long-term pattern points to a business becoming more profitable as it grows. Revenue has nearly doubled since 2021, while operating income and net income have risen even faster, showing that expenses have grown more slowly than sales.
Key Figures
| Metric | Value | Sector ⓘ |
|---|---|---|
| Date | Oct 03, 2026 | |
| Context | ||
| Sector | Financial Services | |
| Industry | Capital Markets | |
| Market Cap ⓘ | $21.78B | |
| Beta ⓘ | 0.63 | |
Value (Cheapness) | ||
| P/E Ratio ⓘ | 24.07 | 12.60 |
| P/B Ratio ⓘ | 3.71 | 1.23 |
| FCF Yield ⓘ | 4.84% | 10.16% |
| Dividend Yield ⓘ | 0.52% | 2.96% |
| EBIT / EV ⓘ | 6.59% | 7.77% |
| PEG ⓘ | 1.62 | |
Growth (Business expansion) | ||
| Revenue Growth ⓘ | 9.00% | 9.50% |
| RPS Growth (5Y CAGR) ⓘ | 16.45% | 12.10% |
| EPS Growth (5Y CAGR) ⓘ | 2.19% | -9.45% |
| BVPS Growth (5Y CAGR) ⓘ | 4.87% | 5.01% |
| Margin Growth (5Y Trend) ⓘ | 22.82% | -4.07% |
| FCF Growth (5Y CAGR) ⓘ | 20.95% | 4.96% |
| DPS Growth (5Y CAGR) ⓘ | 11.19% | 8.79% |
Quality (Business durability) | ||
| ROIC (Latest) ⓘ | 15.27% | 9.60% |
| ROE (Latest) ⓘ | 15.53% | 13.84% |
| ROA (Latest) ⓘ | 11.05% | 1.53% |
| ROIC (5Y Median) ⓘ | 7.52% | 7.86% |
| ROE (5Y Median) ⓘ | 7.95% | 12.20% |
| ROA (5Y Median) ⓘ | 5.48% | 1.29% |
| Net Debt / EBIT (Latest) ⓘ | -1.50 | 0.91 |
| Net Debt / EBIT (5Y Median) ⓘ | -2.55 | 0.74 |
| Net Debt / EBITDA (Latest) ⓘ | -1.26 | 0.97 |
| Operating Margin (Latest) ⓘ | 57.50% | 22.12% |
| Operating Margin (5Y Median) ⓘ | 37.05% | 24.39% |
| Debt to Equity (Latest) ⓘ | 2.27% | 60.37% |
| Profit Margin (Latest) ⓘ | 40.70% | 26.62% |
| Free Cash Flow (Latest) ⓘ | $1.05B | |
Momentum (Price trend) | ||
| 3Y Return ⓘ | +30.69% | +89.23% |
| 12M Return (excl. last month) ⓘ | -12.99% | +17.35% |
| 6M Return ⓘ | -12.64% | +10.00% |
| Price vs. 200-Day MA ⓘ | -4.39% | +3.73% |
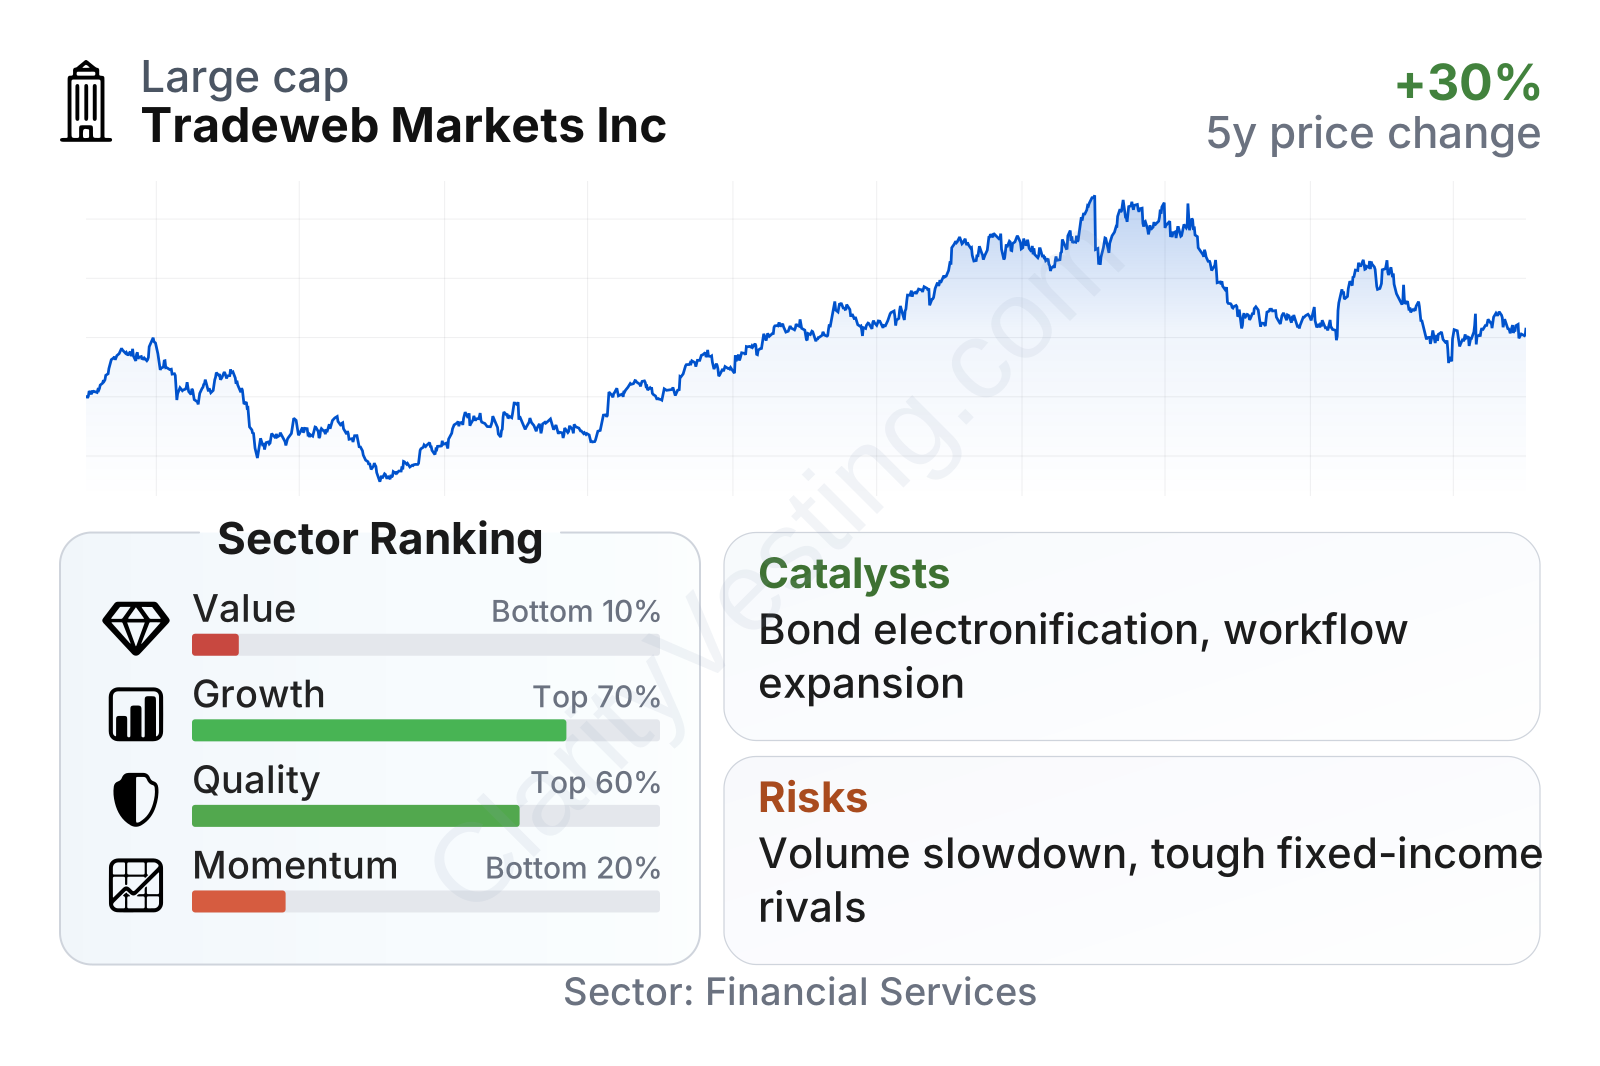
Tradeweb stands out for profitability, cash generation, and balance-sheet strength more than for traditional cheapness. Growth and quality metrics are generally above sector medians, helped by expanding margins, strong free cash flow, and very low leverage. By contrast, value metrics look rich relative to the broader financial sector, and recent share-price momentum has been weak.
The stock-price history also shows that the shares have been volatile even though the business itself has remained fundamentally strong. After a major advance through 2024 and into 2025, the shares pulled back, which reduced some valuation pressure but did not make the stock screen as inexpensive compared with most financial companies.
Growth
Tradeweb operates in a part of financial markets that still has room for structural growth: the ongoing electronification of fixed-income and rates trading. Many bond and rates markets historically relied on phone calls, dealer balance sheets, and fragmented workflows. That has been changing because clients want better price transparency, faster execution, lower processing costs, and tools that can work across multiple dealers and liquidity sources. Those industry trends support continued migration toward platforms like Tradeweb.
The company’s strategy also fits that backdrop well. It has expanded across products, client segments, and trading protocols rather than relying on a single niche. This matters because clients increasingly want one network that can handle government bonds, credit, swaps, repos, ETFs, and related workflow tools. A broad platform can strengthen client retention and create network effects: more users attract more liquidity, and more liquidity attracts more users.
Recent operating performance supports that view. Revenue growth around high single digits year over year is close to the sector median, but the longer-term picture is stronger. Revenue per share has compounded at a mid-teens rate over five years, free cash flow has grown at roughly a 20% annual pace over the same period, and operating margins have improved materially. That combination suggests growth has not been driven only by temporary market conditions.
Earnings per share moved steadily higher from 2021 through 2025, which shows that Tradeweb has been converting revenue growth into bottom-line gains. The rise has been smoother than in many financial firms because the company is more of a marketplace and technology operator than a balance-sheet-heavy lender or trader.
Book value per share has also increased consistently, though at a slower pace than earnings. For a platform business, that is not a negative sign by itself. It reflects a company that generates substantial profits without needing a large amount of capital to support operations.
Important growth catalysts remain visible. Higher adoption of electronic trading in bonds and derivatives, greater automation of dealer-to-client and all-to-all trading, and further expansion in international markets all create room for more volume. Tradeweb has also been broadening products and workflows through targeted launches and acquisitions, which can deepen its role in how clients execute and manage trades rather than serving only as a transaction venue.
A significant recent opportunity is the continued push by large market participants toward automated trading and portfolio-based execution in fixed income. As trading becomes more data-driven and systematic, venues with established liquidity pools and integrated workflows are well placed to capture a larger share of market activity.
Risks
This article is for informational purposes only and does not constitute financial advice. Some content is AI-generated. See Disclaimer


