Stock Analysis · Travere Therapeutics Inc (TVTX)
Overview
Travere Therapeutics is a biotechnology company focused on rare diseases, especially serious kidney and metabolic disorders. Its strategy is relatively easy to understand: find diseases with high unmet medical need, build specialized therapies for small patient populations, and commercialize them through a focused rare-disease sales model. That can create attractive pricing and physician relationships, but it also means the business depends heavily on a limited number of products.
As of 2026, the company’s revenue base is centered on approved medicines, with a growing contribution from its kidney-disease franchise. Based on recent company disclosures, the main sources of revenue are approximately:
- FILSPARI: about 59% of 2025 total revenue. FILSPARI is Travere’s lead commercial product for rare kidney disease and has become the main growth engine.
- Bile acid products: about 31% of 2025 total revenue. This mainly includes products used in rare liver and bile-acid disorders, such as Chenodal and Cholbam.
- Thiola/Thiola EC: about 10% of 2025 total revenue. These products are used for a rare genetic condition that can cause kidney stone formation.
This mix matters because Travere is no longer just managing mature rare-disease assets. It is increasingly becoming a company whose outlook depends on whether FILSPARI can expand, penetrate more patients, and potentially gain broader use in chronic kidney disease subsegments.
The broad financial pattern also shows an important transition. Revenue has risen sharply over the last two years, gross profit has expanded, and losses have narrowed substantially compared with earlier periods. At the same time, operating expenses remain high because the company is still funding research, post-approval development, and commercial expansion.
The business model now looks more commercially developed than it did a few years ago: revenue is scaling faster than cost of revenue, and losses have narrowed dramatically from 2024 to 2025. The key question is whether sales growth can continue fast enough to absorb the still-heavy spending base.
Key Figures
| Metric | Value | Sector ⓘ |
|---|---|---|
| Date | Oct 24, 2026 | |
| Context | ||
| Sector | Healthcare | |
| Industry | Biotechnology | |
| Market Cap ⓘ | $4.89B | |
| Beta ⓘ | 1.14 | |
Value (Cheapness) | ||
| P/E Ratio ⓘ | N/A | 25.42 |
| P/B Ratio ⓘ | 199.87 | 3.08 |
| FCF Yield ⓘ | 1.05% | 3.12% |
| Dividend Yield ⓘ | N/A | 1.85% |
| EBIT / EV ⓘ | -1.00% | 0.56% |
| PEG ⓘ | N/A | |
Growth (Business expansion) | ||
| Revenue Growth ⓘ | 48.20% | 7.50% |
| RPS Growth (5Y CAGR) ⓘ | 25.70% | 8.60% |
| EPS Growth (5Y CAGR) ⓘ | -46.17% | -17.73% |
| BVPS Growth (5Y CAGR) ⓘ | -28.94% | 3.72% |
| Margin Growth (5Y Trend) ⓘ | N/A | -0.57% |
| FCF Growth (5Y CAGR) ⓘ | -14.95% | 0.96% |
| DPS Growth (5Y CAGR) ⓘ | N/A | 6.69% |
Quality (Business durability) | ||
| ROIC (Latest) ⓘ | -8.36% | 3.17% |
| ROA (Latest) ⓘ | -6.50% | 2.98% |
| ROIC (5Y Median) ⓘ | -47.49% | 4.56% |
| ROA (5Y Median) ⓘ | -26.02% | 1.87% |
| Net Debt / EBIT (Latest) ⓘ | N/A | 1.34 |
| Net Debt / EBIT (5Y Median) ⓘ | N/A | 1.86 |
| Net Debt / EBITDA (Latest) ⓘ | 86.39 | 1.00 |
| Net Debt / Assets ⓘ | 62.45% | 5.06% |
| EBITDA / Interest ⓘ | 0.61 | 9.55 |
| Operating Margin (Latest) ⓘ | -9.74% | 9.25% |
| Operating Margin (5Y Median) ⓘ | -149.58% | 7.33% |
| Debt to Equity (Latest) ⓘ | 2515.72% | 26.68% |
| Profit Margin (Latest) ⓘ | -7.35% | 3.34% |
| Free Cash Flow (Latest) ⓘ | $51.52M | |
Momentum (Price trend) | ||
| 3Y Return ⓘ | +645.80% | +51.61% |
| 12M Return (excl. last month) ⓘ | +137.04% | +19.90% |
| 6M Return ⓘ | +30.78% | +10.10% |
| Price vs. 200-Day MA ⓘ | +13.74% | +6.44% |
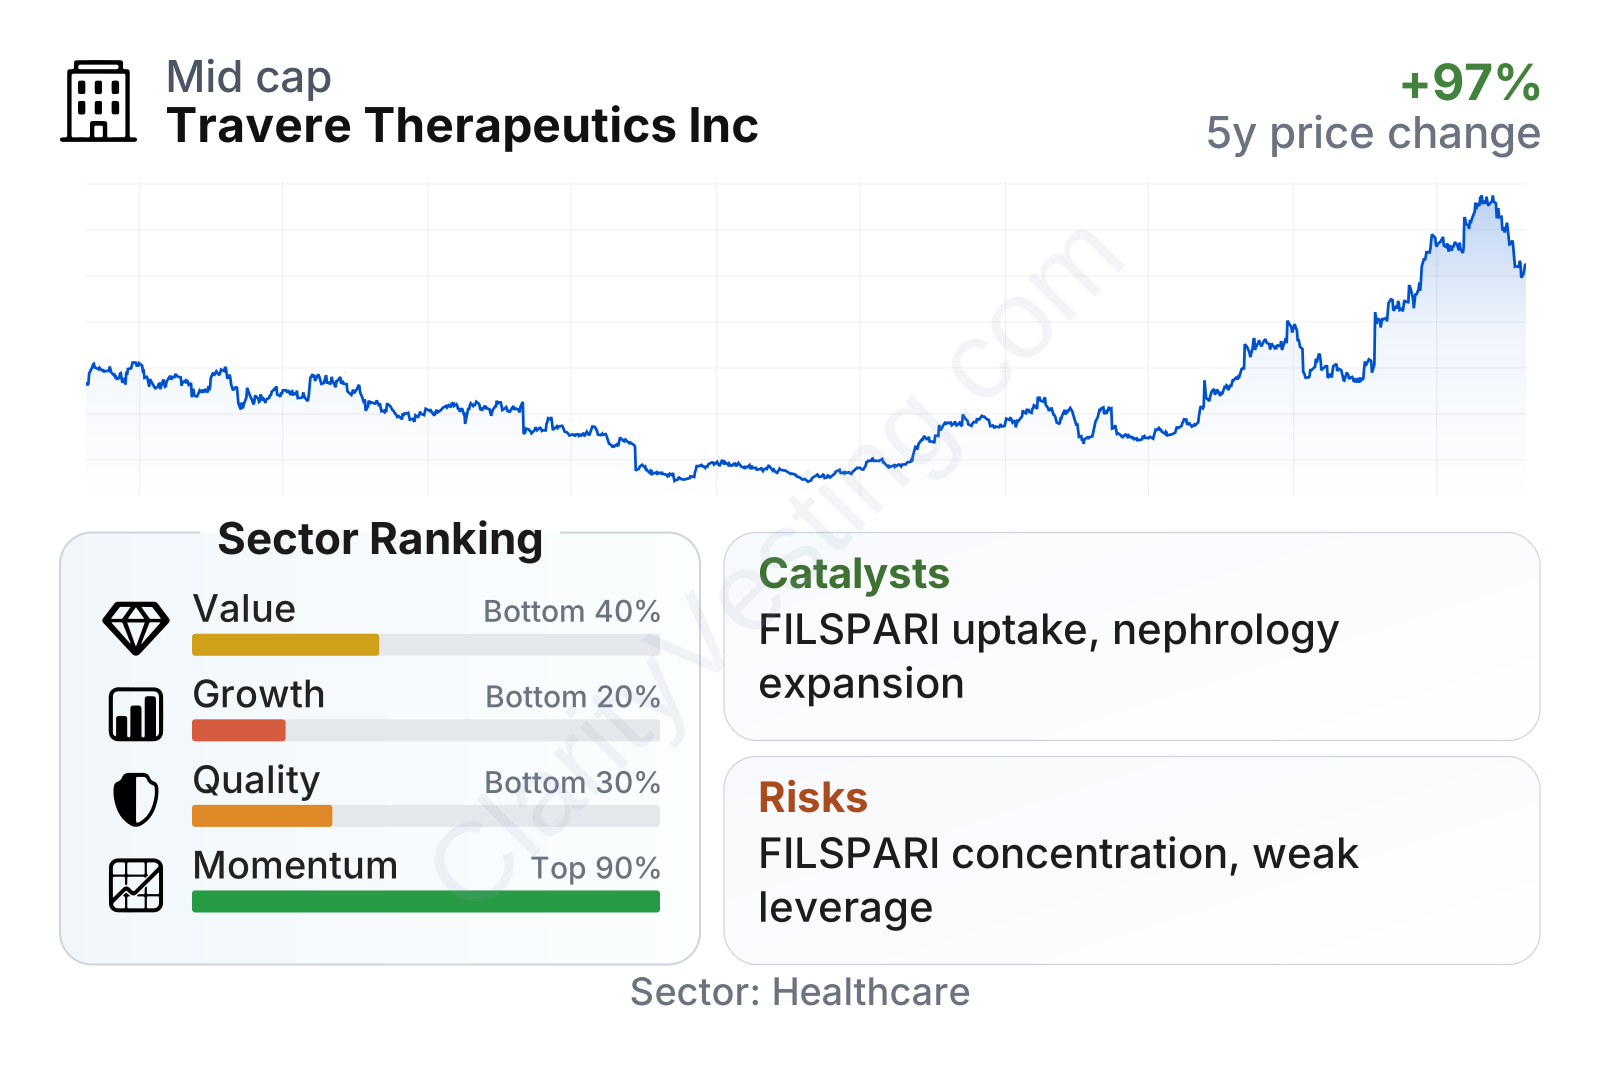
Travere sits in the mid-cap range and has shown very strong stock momentum, with the share price far above where it traded three years ago despite sharp volatility along the way. The factor table paints a mixed picture: market performance has been strong, revenue expansion has been impressive, but profitability, balance-sheet strength, and conventional valuation measures remain weak relative to much of the healthcare sector.
The most notable contrast is that growth in sales has been much better than the sector median, while quality and value indicators still rank poorly. That usually happens when the market is pricing in a major commercial ramp before full earnings power has arrived.
Growth
Travere operates in a favorable part of healthcare. Rare-disease drug development can be attractive because patient populations are clearly defined, treatment needs are often urgent, and competition is sometimes more limited than in broad primary-care markets. In addition, kidney disease remains an area of strong medical need, particularly where patients face progressive loss of kidney function and few targeted therapies are available.
The company’s current growth strategy is centered on turning FILSPARI into a larger franchise. That makes strategic sense because rare kidney diseases can support durable prescribing patterns once physicians gain confidence in efficacy, safety monitoring, and reimbursement access. Management has also been working to increase diagnosis, expand treatment duration, and strengthen payer access, all of which are important in rare-disease commercialization.
Revenue growth has clearly accelerated since 2024. After earlier uneven quarters, the business moved into a much stronger growth phase, with year-over-year gains remaining far above the healthcare sector median. That suggests the commercial ramp is real rather than a one-quarter spike, although the pace has naturally moderated from the highest burst levels seen in 2025.
A major catalyst has been the continued rollout and label progress of FILSPARI. In recent years, the product moved from a narrower launch profile toward broader commercial relevance in rare kidney disease, and that has materially changed the earnings potential of the company. For a business of Travere’s size, a successful orphan-drug launch can have an outsized effect on total revenue.
Another important point for long-term analysis is cash generation. Travere has historically consumed cash, which is common for biotechnology companies, but the trend has improved significantly.
Free cash flow moved sharply closer to break-even by early 2026 after deeply negative levels in prior years. That does not mean the business has fully solved its funding profile, but it does indicate that stronger commercial performance is beginning to offset the cost structure. If that direction continues, the company could move from being viewed mainly as a development-stage biotech toward a more self-funding rare-disease commercial company.
Recent company updates also point to continued opportunity from physician adoption, patient identification, and execution in nephrology. For Travere, these are not abstract themes: they directly affect how many diagnosed patients convert into recurring prescriptions over time.
Risks
This article is for informational purposes only and does not constitute financial advice. Some content is AI-generated. See Disclaimer


