Stock Analysis · Cleanaway Waste Management Limited (TSPCF)
Overview
Cleanaway Waste Management Limited is one of Australia’s largest waste management and environmental services companies. Its business is built around collecting waste from households, businesses, and industrial sites, transporting it, sorting and processing recyclable materials, treating hazardous and specialized waste, and disposing of residual waste through landfills and other infrastructure. In simple terms, it operates across the full chain of waste handling rather than focusing on just one step.
This model matters because waste services tend to be recurring: municipalities, commercial customers, and industrial clients need regular collection and disposal regardless of the economic cycle. At the same time, the company is exposed to higher-value activities such as recycling, resource recovery, and treatment of more complex waste streams, which can support growth when execution is strong.
Based on the company’s recent reporting structure, revenue is mainly generated from the following activities:
- Solid waste services: approximately 70% to 80% of group revenue. This includes collection, transfer, processing, and disposal for municipal, commercial, and industrial customers.
- Industrial and waste services: approximately 15% to 25% of revenue. This covers hazardous and liquid waste, industrial services, health and biohazard solutions, and technical treatment work.
- Recycling and resource recovery-related activities: a smaller but strategically important share, generally embedded across the operating segments. This includes material recovery, recycled commodities, and landfill gas or resource recovery initiatives.
The business mix is supported by a large base of physical assets such as truck fleets, transfer stations, processing facilities, and landfills. That infrastructure creates scale and tends to make the industry harder for smaller competitors to replicate.
Recent financial flow trends show a business that has continued to expand revenue over the last several years, rising from just under A$3.0 billion in fiscal 2022 to above A$4.2 billion in fiscal 2026. However, earnings conversion has been less smooth. Operating income improved materially from 2022 to 2025, then softened in 2026, while interest expense has increased over the same period. That suggests growth is real, but margin stability remains an important issue to watch.
Key Figures
| Metric | Value | Sector ⓘ |
|---|---|---|
| Date | Oct 24, 2026 | |
| Context | ||
| Sector | Industrials | |
| Industry | Waste Management | |
| Market Cap ⓘ | $4.71B | |
| Beta ⓘ | 0.56 | |
Value (Cheapness) | ||
| P/E Ratio ⓘ | 70.00 | 22.29 |
| P/B Ratio ⓘ | 1.57 | 1.98 |
| FCF Yield ⓘ | 9.01% | 6.26% |
| Dividend Yield ⓘ | 4.26% | 1.92% |
| EBIT / EV ⓘ | N/A | 4.83% |
| PEG ⓘ | 1.32 | |
Growth (Business expansion) | ||
| Revenue Growth ⓘ | 14.90% | 9.30% |
| RPS Growth (5Y CAGR) ⓘ | 7.56% | 7.76% |
| EPS Growth (5Y CAGR) ⓘ | 0.77% | -13.17% |
| BVPS Growth (5Y CAGR) ⓘ | 1.50% | 6.13% |
| Margin Growth (5Y Trend) ⓘ | 1.53% | 0.74% |
| FCF Growth (5Y CAGR) ⓘ | N/A | 10.79% |
| DPS Growth (5Y CAGR) ⓘ | 5.50% | 9.41% |
Quality (Business durability) | ||
| ROIC (Latest) ⓘ | N/A | 10.75% |
| ROA (Latest) ⓘ | 3.75% | 5.41% |
| ROIC (5Y Median) ⓘ | 4.30% | 9.37% |
| ROA (5Y Median) ⓘ | 1.50% | 4.95% |
| Net Debt / EBIT (Latest) ⓘ | 3.17 | 2.04 |
| Net Debt / EBIT (5Y Median) ⓘ | 7.83 | 2.27 |
| Net Debt / EBITDA (Latest) ⓘ | 1.46 | 1.39 |
| Net Debt / Assets ⓘ | 30.68% | 19.27% |
| EBITDA / Interest ⓘ | 6.89 | 9.58 |
| Operating Margin (Latest) ⓘ | 8.59% | 10.49% |
| Operating Margin (5Y Median) ⓘ | 6.59% | 10.30% |
| Debt to Equity (Latest) ⓘ | 77.40% | 64.82% |
| Profit Margin (Latest) ⓘ | 2.24% | 6.67% |
| Free Cash Flow (Latest) ⓘ | $424.40M | |
Momentum (Price trend) | ||
| 3Y Return ⓘ | +51.38% | +67.77% |
| 12M Return (excl. last month) ⓘ | +1.59% | +12.05% |
| 6M Return ⓘ | +15.07% | 0.00% |
| Price vs. 200-Day MA ⓘ | +23.08% | +0.67% |
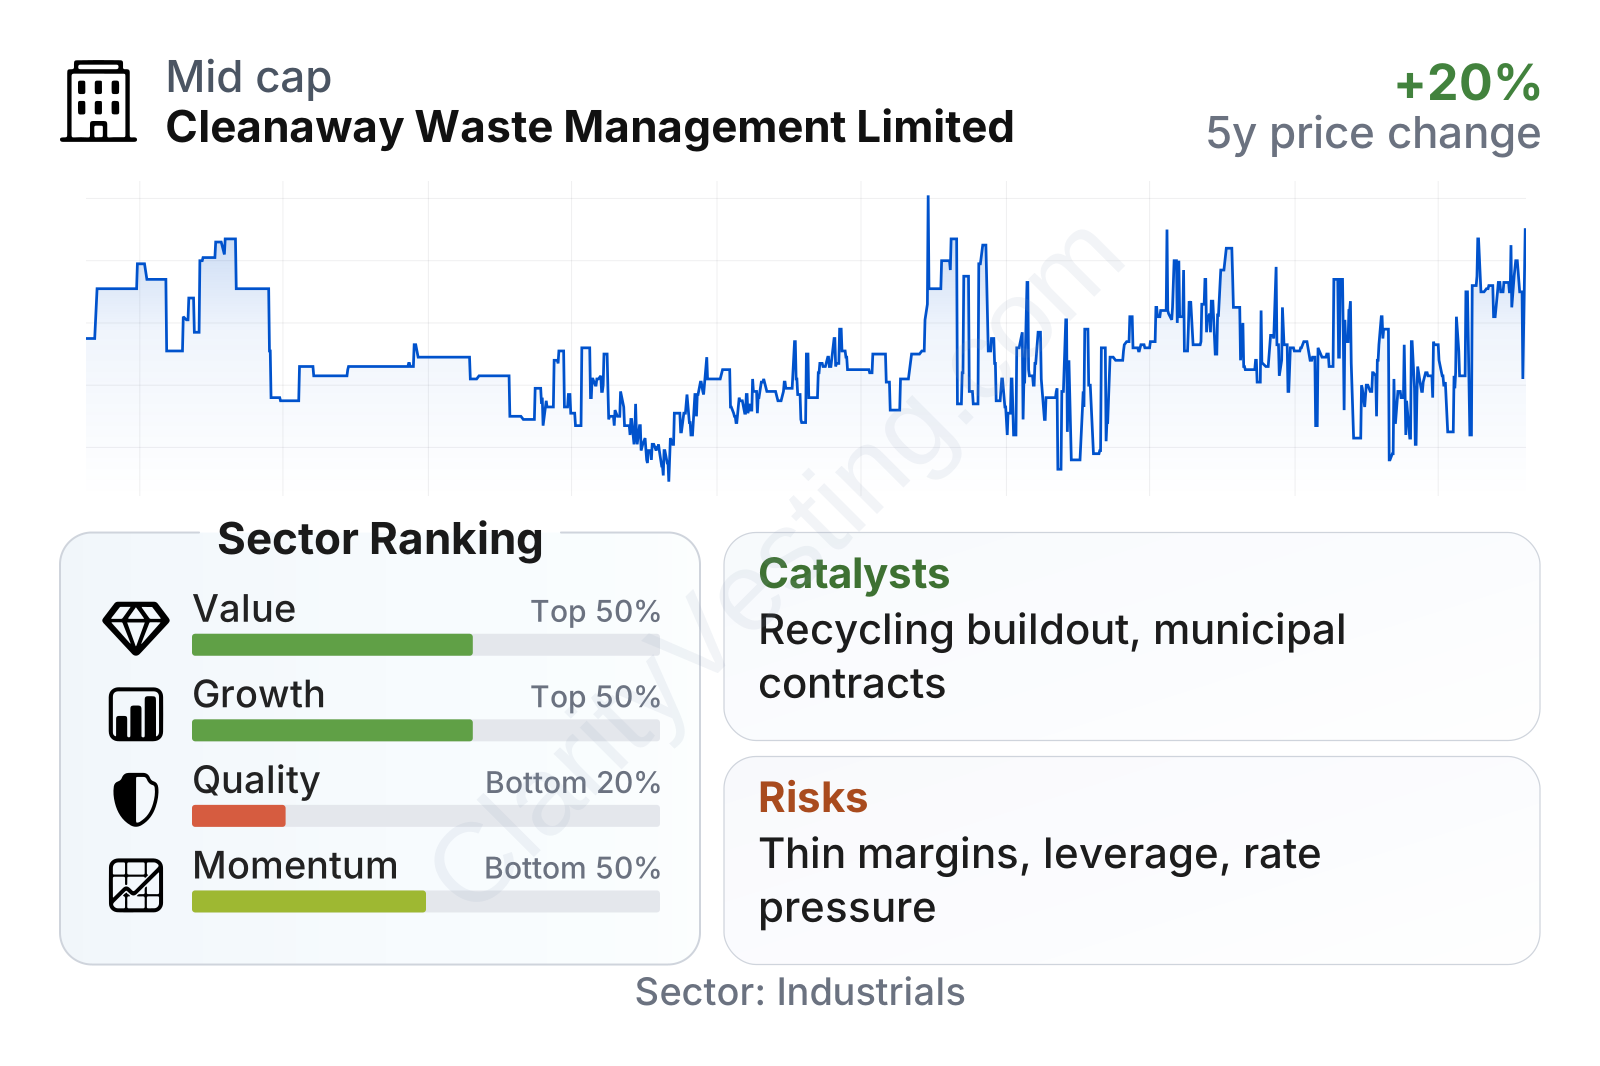
Cleanaway is a mid-sized industrial company by market value, and its share price has been relatively defensive, with a beta well below 1.0. That usually means it has moved less sharply than the broader market, which fits the essential-service nature of waste management.
The overall profile is mixed. On valuation-related measures, the company looks stronger on cash generation and dividend yield than many peers, with free cash flow yield around 9.8% and a trailing dividend yield near 3.6%, both above sector medians. Growth is also respectable, with recent revenue growth near 14.9%, ahead of the sector median, and operating margins have improved over five years even if they remain below industry norms.
The weaker area is business quality. Profitability ratios such as return on assets and long-run returns on invested capital are below sector medians, while leverage is somewhat elevated. Net debt to EBIT is above 3x and interest coverage is lower than the industry median, which helps explain why the quality ranking sits near the bottom of the sector despite decent top-line growth.
On the market side, the stock has not matched the sector over a three-year span, although shorter-term trading has been firmer. That combination often points to a company where investors acknowledge operating progress but still want clearer evidence of durable margin improvement.
Growth
Waste management is generally a favorable long-term sector. Population growth, urbanization, tighter environmental regulation, and rising pressure to reduce landfill use all support demand for collection, treatment, recycling, and recovery services. In Australia, that trend is reinforced by policy support for circular economy initiatives and the need for local processing capacity instead of relying heavily on export channels for recyclable materials.
Cleanaway’s strategy broadly fits that backdrop. The company has spent years building an integrated network that combines collection routes with transfer, processing, landfill, and specialized treatment assets. That is important because the more waste streams it can control internally, the more opportunities it has to improve utilization, capture pricing, and win customers looking for one provider rather than several.
A major growth catalyst in recent years has been the integration and development of post-collection and recycling infrastructure, especially after the acquisition of assets that expanded the company’s position in municipal and recycling operations. This gives Cleanaway a larger base from which to benefit if recycling volumes, commodity recovery, and landfill diversion continue to rise over time.
Another support for future growth is the essential nature of many of its contracts. Municipal collection, commercial recurring services, and industrial compliance work are not highly discretionary. That does not eliminate risk, but it can make revenue more resilient than in many other industrial categories.
Recent revenue expansion into the low-to-mid teens on a yearly basis indicates the company is still participating in sector growth. The more important question now is whether that growth can turn into steadier profit expansion. If management can lift margins through better asset utilization, pricing discipline, and higher-value recovery activities, the company’s earnings profile could look stronger than it has historically.
Risks
This article is for informational purposes only and does not constitute financial advice. Some content is AI-generated. See Disclaimer


