Stock Analysis · Sixth Street Specialty Lending Inc (TSLX)
Overview
Sixth Street Specialty Lending Inc. is a business development company, or BDC. In simple terms, it provides financing to middle-market businesses that are often too large for small-bank lending but not large enough to issue debt easily in the public markets. TSLX mainly lends money, but it can also structure more customized investments such as preferred equity, warrants, and other opportunistic capital solutions. The company is externally managed by Sixth Street Specialty Lending Advisers, which is part of the broader Sixth Street investment platform.
The core business is earning income from its investment portfolio. TSLX focuses heavily on directly originated senior secured loans, which generally sit high in the repayment order if a borrower runs into trouble. That matters because long-term results for a lender depend not only on how much it earns in good periods, but also on how much capital it preserves in weak periods.
Based on recent company filings, revenue is driven primarily by interest and fee income from debt investments, with a smaller contribution from dividends and realized or unrealized gains. Because BDC accounting can move with market values from quarter to quarter, exact percentages change over time, but the recurring operating engine is much clearer:
- Interest income from debt investments: approximately 80% to 90% of total investment income in typical periods. This includes interest earned on first-lien, second-lien, and other structured loans.
- Fee income: approximately 5% to 15%. This can include prepayment fees, original issue discount accretion, amendment fees, and other deal-related income.
- Dividend income and other investment income: generally a small share, often below 10%. This comes from equity co-investments, preferred holdings, and similar instruments.
- Net realized and unrealized gains: variable and not a stable revenue source. These gains or losses can materially affect reported net income, but they are less dependable than recurring interest income.
Over the last several years, total revenue has remained in the same broad range after a sharp rebound in 2023, while net income has moderated from peak levels. At the same time, interest expense has become a more meaningful drag, which reflects the reality of operating a leveraged lender in a higher-rate environment.
The broad picture is that TSLX converts a large share of its revenue into profit, but earnings are sensitive to financing costs, credit conditions, and valuation marks on its investments.
Key Figures
| Metric | Value | Sector ⓘ |
|---|---|---|
| Date | Oct 17, 2026 | |
| Context | ||
| Sector | Financial Services | |
| Industry | Asset Management | |
| Market Cap ⓘ | $1.64B | |
| Beta ⓘ | 0.66 | |
Value (Cheapness) | ||
| P/E Ratio ⓘ | 18.47 | 12.26 |
| P/B Ratio ⓘ | 1.08 | 1.23 |
| FCF Yield ⓘ | 9.51% | 10.40% |
| Dividend Yield ⓘ | 11.04% | 3.02% |
| EBIT / EV ⓘ | N/A | 8.14% |
| PEG ⓘ | 1.28 | |
Growth (Business expansion) | ||
| Revenue Growth ⓘ | -14.90% | 9.35% |
| RPS Growth (5Y CAGR) ⓘ | 7.18% | 12.19% |
| EPS Growth (5Y CAGR) ⓘ | -20.93% | -9.53% |
| BVPS Growth (5Y CAGR) ⓘ | 0.84% | 4.99% |
| Margin Growth (5Y Trend) ⓘ | 64.05% | -3.86% |
| FCF Growth (5Y CAGR) ⓘ | 192.82% | 4.81% |
| DPS Growth (5Y CAGR) ⓘ | -10.92% | 8.79% |
Quality (Business durability) | ||
| ROIC (Latest) ⓘ | N/A | 9.49% |
| ROE (Latest) ⓘ | 5.62% | 13.90% |
| ROA (Latest) ⓘ | 2.53% | 1.55% |
| ROIC (5Y Median) ⓘ | 5.18% | 7.86% |
| ROE (5Y Median) ⓘ | 12.02% | 12.17% |
| ROA (5Y Median) ⓘ | 5.39% | 1.30% |
| Net Debt / EBIT (Latest) ⓘ | N/A | 0.96 |
| Net Debt / EBIT (5Y Median) ⓘ | 5.58 | 0.73 |
| Net Debt / EBITDA (Latest) ⓘ | 11.58 | 0.92 |
| Operating Margin (Latest) ⓘ | N/A | 22.30% |
| Operating Margin (5Y Median) ⓘ | 53.21% | 24.63% |
| Debt to Equity (Latest) ⓘ | 124.31% | 58.56% |
| Profit Margin (Latest) ⓘ | 21.78% | 26.57% |
| Free Cash Flow (Latest) ⓘ | $155.83M | |
Momentum (Price trend) | ||
| 3Y Return ⓘ | +18.48% | +88.33% |
| 12M Return (excl. last month) ⓘ | -15.89% | +19.38% |
| 6M Return ⓘ | -3.89% | +4.75% |
| Price vs. 200-Day MA ⓘ | -0.77% | +3.50% |
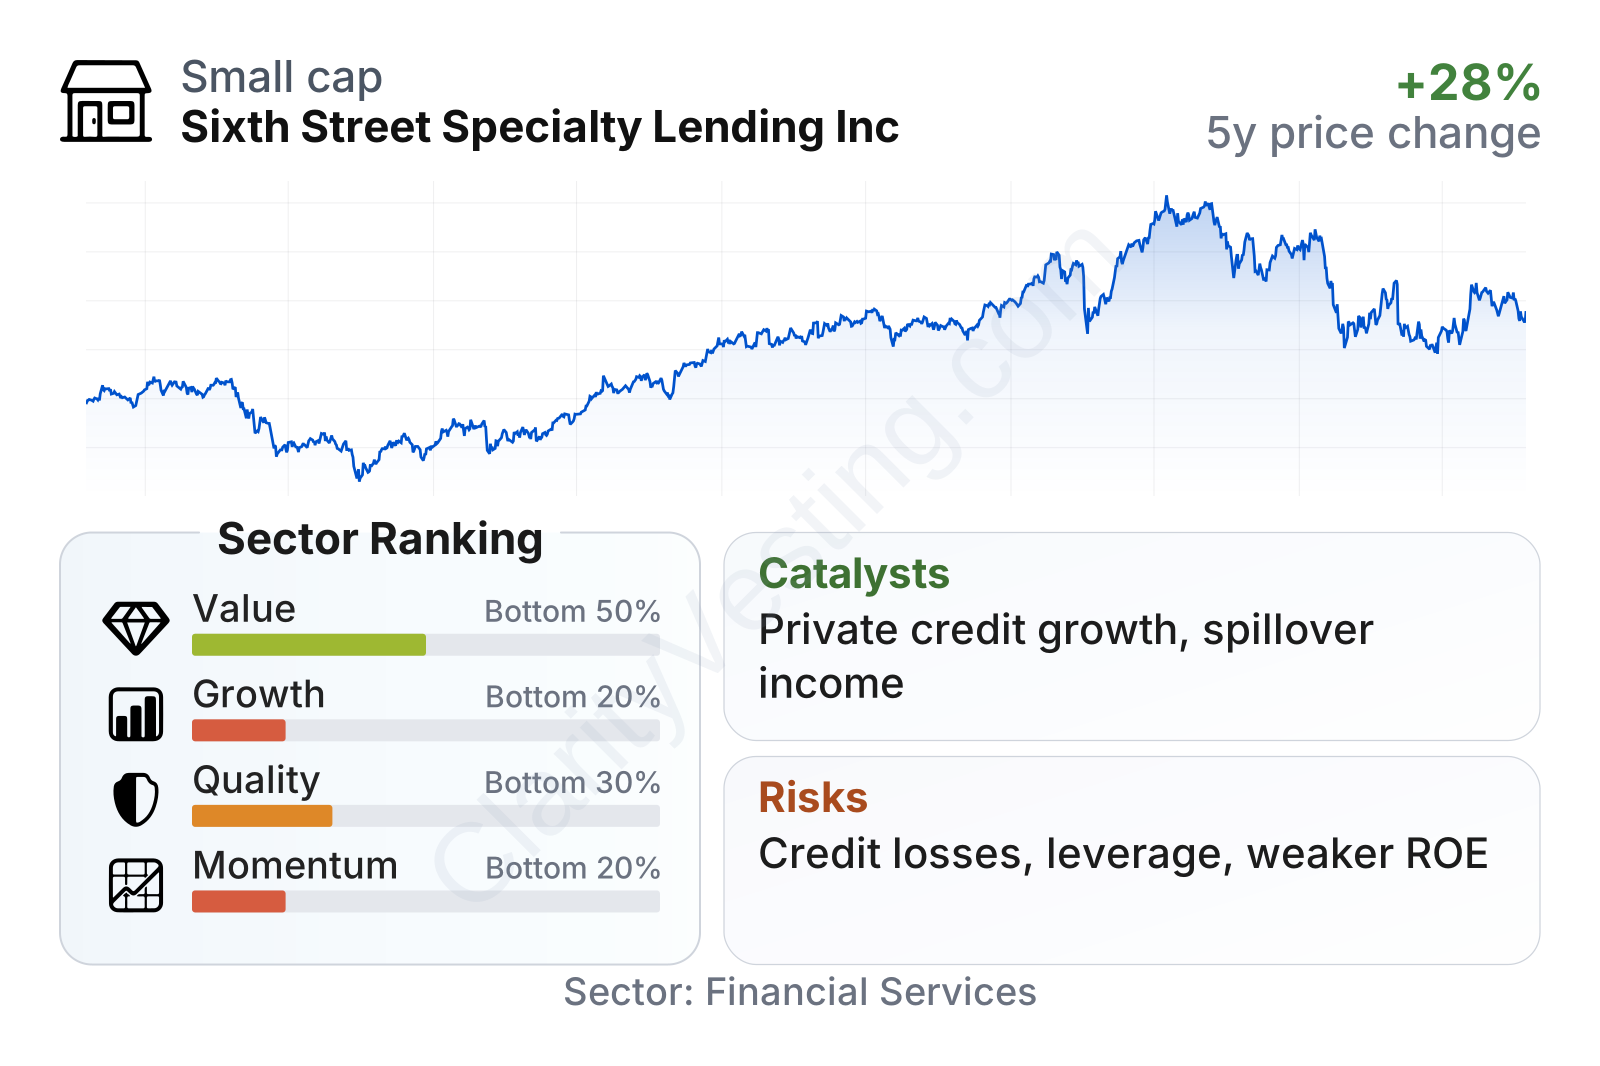
TSLX is a mid-sized publicly traded lender with a relatively low-beta stock, which means its share price has historically moved less than the broader market. The latest profile is mixed: income generation remains notable, especially through a dividend yield around 10%, but the company ranks weaker on growth, quality, and momentum versus much of the financial sector. The valuation picture is also split, with a price-to-earnings ratio above the sector median but a price-to-book ratio still slightly below the sector median. That usually suggests the market is willing to pay for TSLX’s income stream, while remaining more cautious about its longer-term growth outlook.
The stock chart shows that shares recovered strongly from 2022 lows, reached a high point in 2025, and then gave back part of that advance in 2026. That pattern fits a lender whose results are closely tied to credit spreads, interest rates, and investor confidence in portfolio valuations.
Growth
TSLX operates in a part of finance that has had structural support for years: private credit. Banks have become more constrained in many forms of middle-market lending, which has opened room for specialized direct lenders. That backdrop remains favorable over the long term, especially for firms with sourcing networks, underwriting discipline, and the ability to provide flexible financing rather than commodity loans.
TSLX’s strategy is sensible for that environment. The company emphasizes senior secured lending, selective equity participation, and direct origination. It also benefits from being connected to the broader Sixth Street platform, which can help with deal flow, industry knowledge, and capital markets relationships. For a BDC, scale and network matter because attractive lending opportunities are not distributed evenly across the market.
At the same time, the recent growth profile has cooled. Revenue has declined year over year, the five-year growth in revenue per share is positive but modest, and book value per share has been nearly flat over a longer period. That suggests the business is producing income, but not compounding capital at a fast rate.
Earnings per share improved steadily from 2021 through 2024, then slipped slightly in 2025. That is not a collapse, but it does suggest that the strongest part of the earnings cycle may have passed unless new originations or portfolio performance re-accelerate.
Book value per share has been comparatively stable, with some erosion after 2023. For a BDC, this is one of the most important long-term markers because it indicates whether the lender is preserving shareholder capital after dividends, credit losses, and valuation adjustments. Stability is positive, but the lack of stronger growth limits the compounding case.
A meaningful catalyst is the continued expansion of private credit as an asset class. Another is the possibility that market volatility or tighter bank lending standards create more attractive lending spreads for disciplined direct lenders. Company filings and investor materials have also emphasized portfolio rotation and selective origination, which can support income if management finds high-quality borrowers at favorable terms.
Recent company updates in 2026 have continued to show active portfolio management, regular dividends, and supplemental distributions, signaling that management still sees enough earnings power and spillover income to support shareholder payouts. That does not by itself guarantee growth, but it does indicate ongoing portfolio cash generation.
Risks
This article is for informational purposes only and does not constitute financial advice. Some content is AI-generated. See Disclaimer


