Stock Analysis · T. Rowe Price Group Inc (TROW)
Overview
T. Rowe Price Group is a large U.S. asset manager. In simple terms, it manages money on behalf of individuals, retirement plans, advisers, institutions, and other clients. The company offers mutual funds, exchange-traded funds, separately managed accounts, model portfolios, retirement solutions, and investment-advisory services. Its business is built around charging fees based mainly on the amount of client assets it manages, which means revenue tends to rise when market levels and client balances rise, and soften when markets fall or clients withdraw money.
The company’s revenue base is still centered on investment-advisory fees, with smaller contributions from administrative and distribution-related fees as well as investment income and other items. Based on recent annual reporting, the revenue mix can be summarized approximately as follows:
- Investment advisory fees: about 80% to 85% — fees earned for managing mutual funds, retirement accounts, separate accounts, trusts, and other portfolios. This is the company’s core activity.
- Administrative, distribution, and servicing fees: about 10% to 15% — support services tied to its fund and client platform, including transfer agency and related servicing functions.
- Net revenues from advisory and other activities plus investment income: about 5% to 10% — includes smaller business lines and income from the firm’s own balance-sheet investments.
T. Rowe Price is also geographically more U.S.-focused than some of the biggest global peers, although it serves clients internationally. That matters because its growth depends not only on investment performance and product mix, but also on whether it can broaden distribution outside its traditional core and capture more flows in faster-growing areas such as retirement solutions, ETFs, fixed income, and alternative strategies.
Over the last several years, the business has shown how sensitive asset management can be to market cycles. Revenue and profit dropped sharply in the 2022 downturn, then recovered as markets improved. More recently, sales have moved back above the 2022-2023 lows, while profitability remains solid.
The long-term pattern shows a cyclical but resilient model: revenue rebounded after the 2022 slump, and net income recovered as well, though not back to the unusually strong 2021 peak. That is typical for an asset manager whose fees depend heavily on asset values and investor flows.
Key Figures
| Metric | Value | Sector ⓘ |
|---|---|---|
| Date | Oct 17, 2026 | |
| Context | ||
| Sector | Financial Services | |
| Industry | Asset Management | |
| Market Cap ⓘ | $21.25B | |
| Beta ⓘ | 1.47 | |
Value (Cheapness) | ||
| P/E Ratio ⓘ | 10.18 | 12.26 |
| P/B Ratio ⓘ | 2.21 | 1.23 |
| FCF Yield ⓘ | 10.24% | 10.40% |
| Dividend Yield ⓘ | 5.07% | 3.02% |
| EBIT / EV ⓘ | 12.77% | 8.14% |
| PEG ⓘ | 2.16 | |
Growth (Business expansion) | ||
| Revenue Growth ⓘ | 10.70% | 9.35% |
| RPS Growth (5Y CAGR) ⓘ | -0.63% | 12.19% |
| EPS Growth (5Y CAGR) ⓘ | -11.39% | -9.53% |
| BVPS Growth (5Y CAGR) ⓘ | 3.02% | 4.99% |
| Margin Growth (5Y Trend) ⓘ | -14.92% | -3.86% |
| FCF Growth (5Y CAGR) ⓘ | -17.63% | 4.81% |
| DPS Growth (5Y CAGR) ⓘ | -8.97% | 8.79% |
Quality (Business durability) | ||
| ROIC (Latest) ⓘ | 17.55% | 9.49% |
| ROE (Latest) ⓘ | 22.53% | 13.90% |
| ROA (Latest) ⓘ | 14.77% | 1.55% |
| ROIC (5Y Median) ⓘ | 18.90% | 7.86% |
| ROE (5Y Median) ⓘ | 21.54% | 12.17% |
| ROA (5Y Median) ⓘ | 14.87% | 1.30% |
| Net Debt / EBIT (Latest) ⓘ | -1.13 | 0.96 |
| Net Debt / EBIT (5Y Median) ⓘ | -0.89 | 0.73 |
| Net Debt / EBITDA (Latest) ⓘ | -0.90 | 0.92 |
| Operating Margin (Latest) ⓘ | 32.81% | 22.30% |
| Operating Margin (5Y Median) ⓘ | 34.91% | 24.63% |
| Debt to Equity (Latest) ⓘ | 3.90% | 58.56% |
| Profit Margin (Latest) ⓘ | 29.26% | 26.57% |
| Free Cash Flow (Latest) ⓘ | $2.18B | |
Momentum (Price trend) | ||
| 3Y Return ⓘ | +17.01% | +88.33% |
| 12M Return (excl. last month) ⓘ | +5.32% | +19.38% |
| 6M Return ⓘ | +8.07% | +4.75% |
| Price vs. 200-Day MA ⓘ | -0.30% | +3.50% |
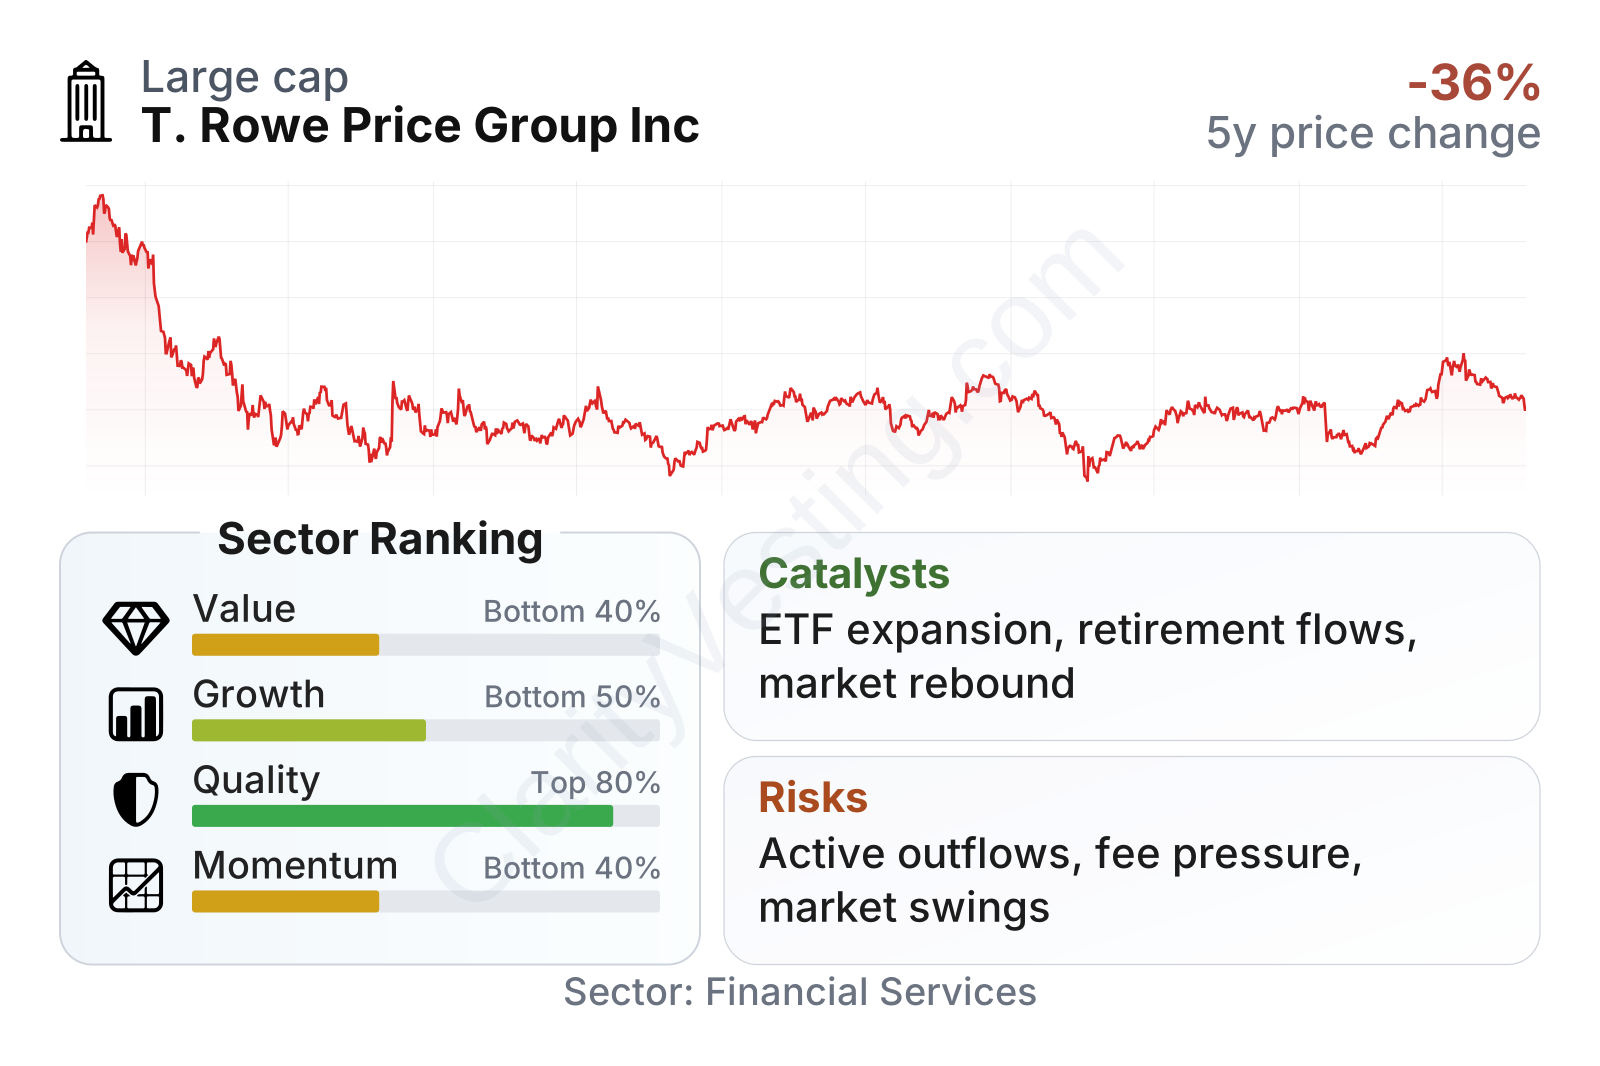
T. Rowe Price stands out more for business quality than for growth or momentum. Profitability measures are well above sector medians, supported by strong margins, high returns on capital, and a balance sheet with very little debt. The weaker areas are multi-year growth and relative share performance, reflecting how hard 2022 was for active managers and how uneven the recovery has been. On valuation, the picture is mixed: earnings-based measures look moderate, while book-based valuation remains above the sector median, suggesting the market still gives the company credit for franchise quality.
The stock’s path since 2021 also highlights its cyclical nature. Shares fell steeply during the market and flow pressure of 2022, then recovered in a choppy way rather than in a straight line. That pattern fits a business that is profitable and cash generative, but closely tied to investor sentiment and market levels.
Growth
Asset management remains a growing industry over the long run because retirement savings, wealth accumulation, and demand for professional investment products tend to rise over time. But growth inside the sector is not evenly distributed. Passive products, low-cost ETFs, retirement solutions, and private-market strategies have generally attracted more demand than traditional actively managed U.S. equity funds. For T. Rowe Price, that means the sector itself is expanding, but the company’s growth depends on adapting its product mix rather than simply riding industry growth.
T. Rowe Price’s strategy is sensible in that context. The company has been expanding its ETF lineup, broadening fixed-income and multi-asset offerings, developing retirement-date and retirement-income solutions, and building out alternatives and global distribution. These moves are important because they can reduce dependence on the firm’s traditional active equity franchise, which has faced industry-wide fee and flow pressure.
Earnings per share show the business cycle clearly: a very strong 2021 was followed by a sharp drop in 2022 and softer 2023 results, then a recovery in 2024 and 2025. That rebound matters because it suggests the company still has meaningful operating leverage. When assets under management recover and fee pressure is manageable, profits can improve relatively quickly.
Book value per share has moved upward over the last several years. That points to ongoing value creation despite a difficult stretch for earnings growth. In other words, even though profit growth has been uneven, the company has continued to build shareholder equity and preserve financial strength.
A practical catalyst for future growth is the combination of market appreciation and better net flows. If investment performance supports stronger inflows, revenue can rise without the company needing a major increase in fixed costs. Another catalyst is the firm’s retirement franchise, where long-duration client relationships and recurring contributions can provide steadier asset gathering than more transactional channels.
Recent company communications have also emphasized continued product development in active ETFs, model portfolios, retirement income, and alternative capabilities. None of these is likely to transform results overnight, but together they improve the odds that T. Rowe Price can participate in the parts of asset management that are still expanding fastest.
Risks
This article is for informational purposes only and does not constitute financial advice. Some content is AI-generated. See Disclaimer


