Stock Analysis · Trinity Industries Inc (TRN)
Overview
Trinity Industries is a North American railcar company focused on freight transportation equipment and related services. In simple terms, it builds railcars, leases them to customers, and helps keep those railcars running through maintenance and support services. Its customers include shippers, railroads, leasing companies, and industrial businesses that move products such as chemicals, agriculture goods, construction materials, energy products, and consumer goods by rail.
The business is built around two main activities: manufacturing railcars and earning recurring income from a leased fleet. That combination matters because manufacturing can be more cyclical, while leasing and services can provide steadier cash generation over time.
Based on recent company reporting, Trinity’s revenue mix is broadly concentrated in the following areas:
- Railcar leasing and management services: approximately 55% to 65% of revenue. This includes lease income from owned and partially owned railcars, fleet management, and related services.
- Rail products and related manufacturing: approximately 35% to 45% of revenue. This includes railcar manufacturing, parts, maintenance, modifications, and other rail-related products and services.
That mix can shift from year to year depending on delivery timing, railcar order activity, and gains from equipment sales, but the broad picture is clear: Trinity is no longer just a manufacturer. It is increasingly shaped by its leasing platform, which tends to carry higher margins and longer customer relationships.
The multi-year financial flow also shows an important change: revenue expanded strongly through 2024, then pulled back in 2025, yet operating income and net income held up better than sales. That suggests a business mix moving toward more profitable activities, especially leasing and service revenue, even while top-line growth became less consistent.
Key Figures
| Metric | Value | Sector ⓘ |
|---|---|---|
| Date | Oct 17, 2026 | |
| Context | ||
| Sector | Industrials | |
| Industry | Railroads | |
| Market Cap ⓘ | $2.09B | |
| Beta ⓘ | 1.35 | |
Value (Cheapness) | ||
| P/E Ratio ⓘ | 6.16 | 22.10 |
| P/B Ratio ⓘ | 1.87 | 1.97 |
| FCF Yield ⓘ | -16.80% | 6.38% |
| Dividend Yield ⓘ | 4.74% | 1.94% |
| EBIT / EV ⓘ | 10.21% | 4.79% |
| PEG ⓘ | 0.69 | |
Growth (Business expansion) | ||
| Revenue Growth ⓘ | -4.20% | 9.30% |
| RPS Growth (5Y CAGR) ⓘ | 15.53% | 7.81% |
| EPS Growth (5Y CAGR) ⓘ | N/A | -13.06% |
| BVPS Growth (5Y CAGR) ⓘ | 5.25% | 6.14% |
| Margin Growth (5Y Trend) ⓘ | 13.85% | 0.88% |
| FCF Growth (5Y CAGR) ⓘ | N/A | 11.01% |
| DPS Growth (5Y CAGR) ⓘ | 8.71% | 9.48% |
Quality (Business durability) | ||
| ROIC (Latest) ⓘ | 8.53% | 10.84% |
| ROA (Latest) ⓘ | 4.00% | 5.41% |
| ROIC (5Y Median) ⓘ | 5.65% | 9.38% |
| ROA (5Y Median) ⓘ | 1.56% | 4.95% |
| Net Debt / EBIT (Latest) ⓘ | 6.82 | 2.08 |
| Net Debt / EBIT (5Y Median) ⓘ | 13.60 | 2.27 |
| Net Debt / EBITDA (Latest) ⓘ | 4.86 | 1.39 |
| Net Debt / Assets ⓘ | 61.60% | 19.28% |
| EBITDA / Interest ⓘ | 3.99 | 9.58 |
| Operating Margin (Latest) ⓘ | 36.43% | 10.50% |
| Operating Margin (5Y Median) ⓘ | 16.27% | 10.29% |
| Debt to Equity (Latest) ⓘ | 457.22% | 65.48% |
| Profit Margin (Latest) ⓘ | 16.62% | 6.67% |
| Free Cash Flow (Latest) ⓘ | -$351.30M | |
Momentum (Price trend) | ||
| 3Y Return ⓘ | +32.98% | +61.68% |
| 12M Return (excl. last month) ⓘ | +3.78% | +12.58% |
| 6M Return ⓘ | -23.25% | 0.00% |
| Price vs. 200-Day MA ⓘ | -16.30% | +0.02% |
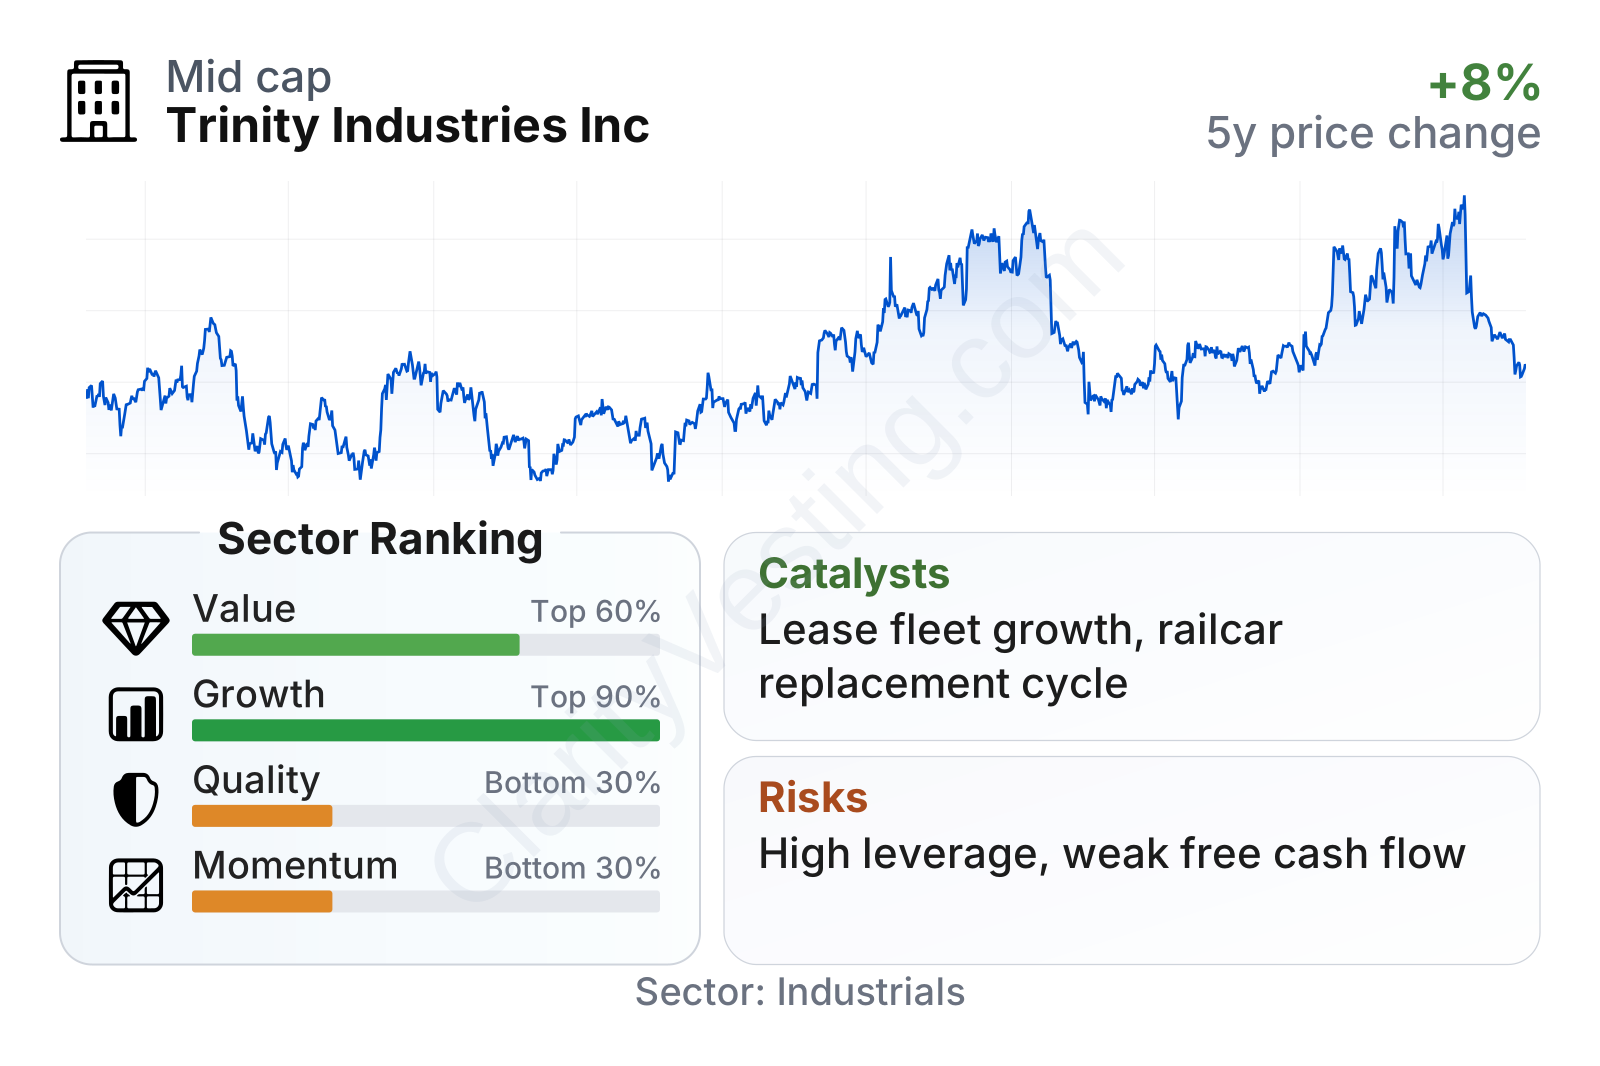
Trinity is a mid-sized industrial company with a stock that has been noticeably volatile, which fits a business tied to freight demand, interest rates, and equipment cycles. The current factor profile is unusual: growth ranks well versus the broader industrial sector, while quality and recent momentum rank weaker. Valuation metrics look inexpensive on earnings, with a P/E far below the sector median, and the dividend yield is also above average. The main caution is cash flow and leverage, which are much less favorable than the earnings multiple alone suggests.
Growth
Freight rail remains an important part of the North American transport system because it is cost-efficient for moving large volumes over long distances. That gives Trinity exposure to a sector with durable long-term relevance, even if demand moves in cycles. Railcar replacement needs, fleet modernization, and demand for specialized cars for chemicals, aggregates, food products, and energy-related cargo all support the industry over time.
Trinity’s strategy for growth is understandable and fairly coherent. Rather than relying only on selling newly built railcars, the company has spent years building a larger leasing and services platform. This can improve earnings stability, deepen customer ties, and create recurring revenue. It also gives Trinity more ways to benefit from its installed base after the initial railcar sale.
Recent revenue trends show why this business needs to be viewed over a full cycle rather than quarter by quarter. Trinity posted very strong growth in 2022 and 2023, stayed positive for much of 2024, and then moved into contraction during late 2024 and into 2025 and 2026. Even so, its five-year revenue-per-share growth remains stronger than the sector median, which suggests the longer-term expansion has still been meaningful despite the current slowdown.
Cash generation is less smooth than accounting profit. Free cash flow has swung sharply between positive and negative territory, which is common for leasing-heavy and asset-intensive businesses because railcars require large up-front capital investment. For Trinity, that means growth can be attractive when lease rates and utilization are healthy, but cash flow can look weak during periods of heavy fleet investment.
A meaningful catalyst is the size and economics of the lease fleet. When utilization stays strong and lease rates improve on renewals, the company can grow earnings without needing the same level of manufacturing growth. Another potential tailwind is replacement demand for older railcars across North America. Public company updates have also emphasized efforts around fleet optimization, maintenance services, and disciplined capital allocation, all of which can support earnings if execution remains solid.
Risks
This article is for informational purposes only and does not constitute financial advice. Some content is AI-generated. See Disclaimer


