Stock Analysis · Trustmark Corporation (TRMK)
Overview
Trustmark Corporation is a regional banking company based in the southern United States. Through Trustmark National Bank and related businesses, it provides traditional banking services such as deposits, commercial and consumer lending, mortgage banking, wealth management, and insurance solutions. Its footprint is concentrated in states including Mississippi, Alabama, Florida, Tennessee, and Texas, giving it a strong position in community and mid-sized business banking rather than national-scale finance.
Its revenue mix is led by net interest income, which is the spread between what the bank earns on loans and securities and what it pays on deposits and other funding. Noninterest income adds a second layer through fees and service businesses. Based on recent annual reporting, the revenue base can be summarized approximately as follows:
- Net interest income: about 70% to 80% of total revenue. This includes income from commercial loans, consumer loans, mortgage lending, and securities after funding costs.
- Insurance, wealth, and service fees: about 20% to 30% of total revenue combined. This includes insurance commissions, trust and asset management fees, deposit account charges, card and payment fees, and mortgage banking income.
That mix matters because Trustmark is not purely dependent on loan spreads. The fee-based businesses help diversify results, although the bank still remains mainly driven by interest rates, credit quality, and deposit trends.
Over the last several years, revenue has moved higher overall, and earnings have improved after a weaker 2022 period. The business also appears to have preserved decent profitability while growing book value per share, a key measure for banks because it reflects the equity backing the franchise.
The broad pattern shows a business that has expanded revenue meaningfully since 2021, with net income recovering strongly after 2022. It also shows how sensitive bank earnings can be to funding costs and operating expenses: revenue growth has been solid, but the path from revenue to profit has not been perfectly smooth.
Key Figures
| Metric | Value | Sector ⓘ |
|---|---|---|
| Date | Oct 24, 2026 | |
| Context | ||
| Sector | Financial Services | |
| Industry | Banks - Regional | |
| Market Cap ⓘ | $2.64B | |
| Beta ⓘ | 0.66 | |
Value (Cheapness) | ||
| P/E Ratio ⓘ | 11.49 | 12.46 |
| P/B Ratio ⓘ | 1.27 | 1.25 |
| FCF Yield ⓘ | 7.19% | 9.82% |
| Dividend Yield ⓘ | 2.16% | 2.94% |
| EBIT / EV ⓘ | 10.75% | 8.11% |
| PEG ⓘ | 2.29 | |
Growth (Business expansion) | ||
| Revenue Growth ⓘ | 9.00% | 9.10% |
| RPS Growth (5Y CAGR) ⓘ | 19.69% | 12.31% |
| EPS Growth (5Y CAGR) ⓘ | -5.78% | -6.97% |
| BVPS Growth (5Y CAGR) ⓘ | 6.10% | 5.02% |
| Margin Growth (5Y Trend) ⓘ | -5.39% | -4.00% |
| FCF Growth (5Y CAGR) ⓘ | -8.39% | 4.71% |
| DPS Growth (5Y CAGR) ⓘ | 1.15% | 8.92% |
Quality (Business durability) | ||
| ROIC (Latest) ⓘ | 9.13% | 9.18% |
| ROE (Latest) ⓘ | 11.01% | 13.93% |
| ROA (Latest) ⓘ | 1.23% | 1.57% |
| ROIC (5Y Median) ⓘ | 6.65% | 7.80% |
| ROE (5Y Median) ⓘ | 10.49% | 12.15% |
| ROA (5Y Median) ⓘ | 0.90% | 1.28% |
| Net Debt / EBIT (Latest) ⓘ | 0.34 | 1.02 |
| Net Debt / EBIT (5Y Median) ⓘ | 1.57 | 0.72 |
| Net Debt / EBITDA (Latest) ⓘ | 0.29 | 0.88 |
| Operating Margin (Latest) ⓘ | 24.98% | 22.30% |
| Operating Margin (5Y Median) ⓘ | 25.51% | 24.50% |
| Debt to Equity (Latest) ⓘ | 35.87% | 59.34% |
| Profit Margin (Latest) ⓘ | 28.74% | 26.42% |
| Free Cash Flow (Latest) ⓘ | $189.70M | |
Momentum (Price trend) | ||
| 3Y Return ⓘ | +144.78% | +95.73% |
| 12M Return (excl. last month) ⓘ | +16.50% | +17.30% |
| 6M Return ⓘ | +5.28% | +6.07% |
| Price vs. 200-Day MA ⓘ | +4.72% | +5.36% |
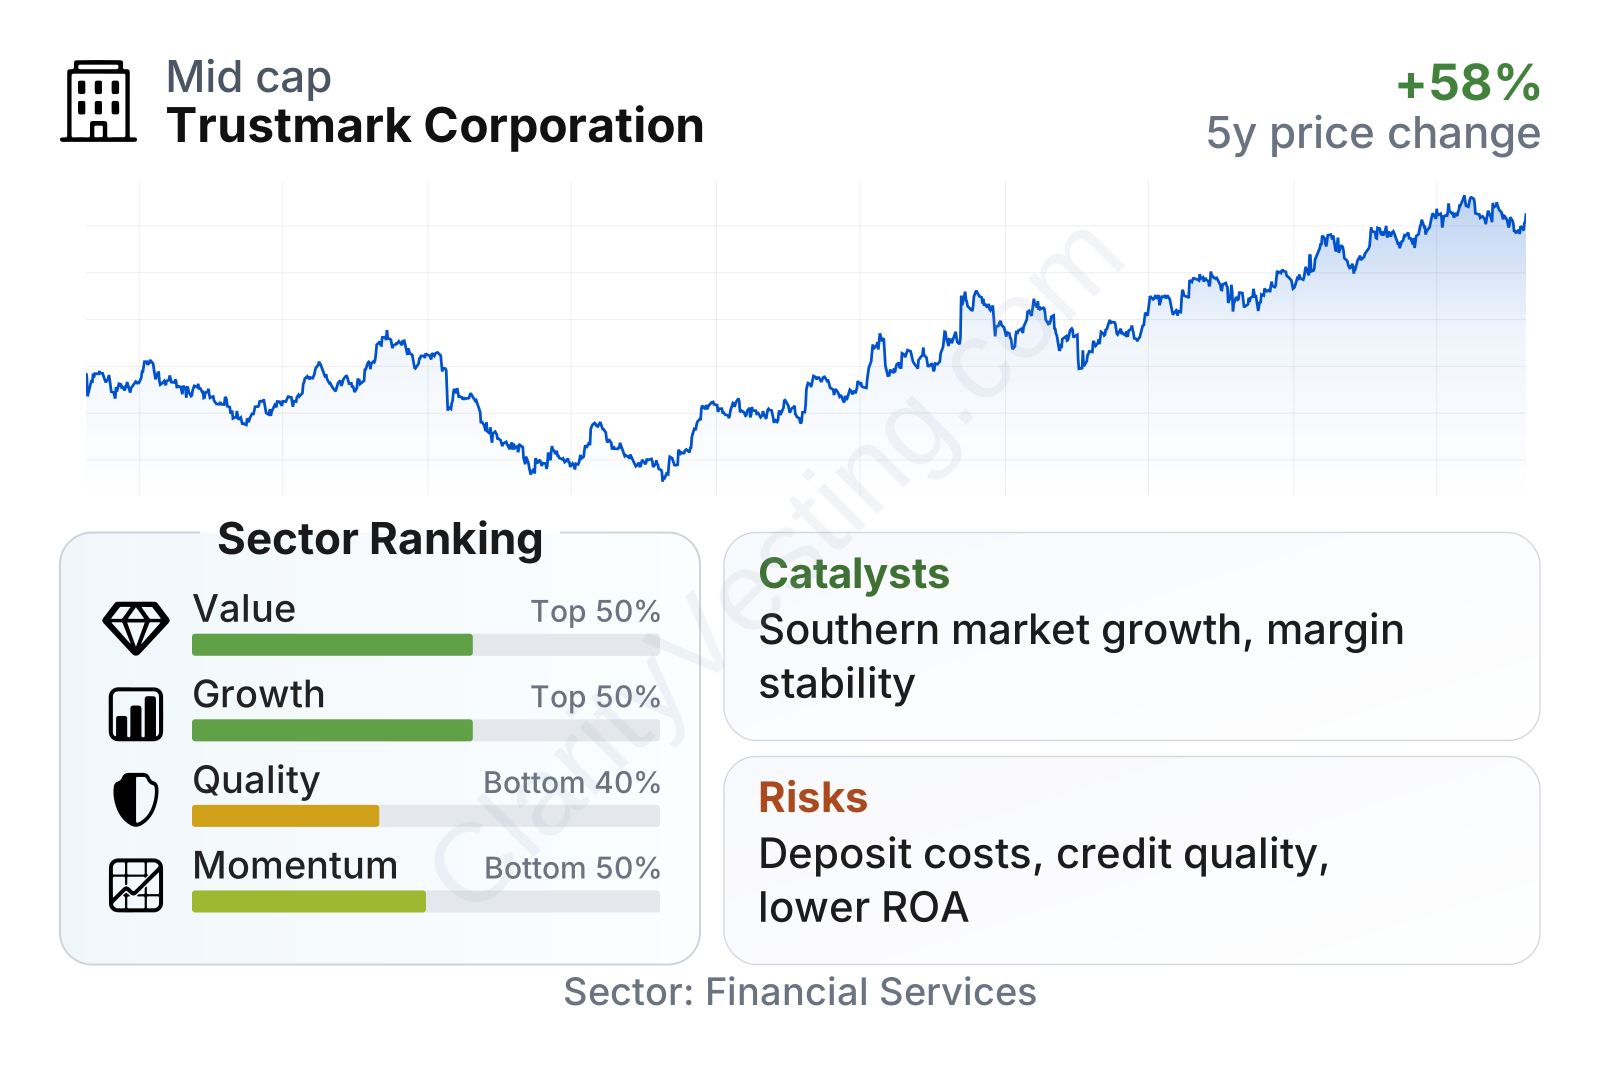
Trustmark is a mid-sized regional bank with a relatively low share-price volatility profile, as reflected by a beta well below 1. On valuation, the shares trade near the sector median on earnings and slightly above the median on book value, which suggests the market is not placing it in either the cheapest or the most expensive group. Profitability metrics are mixed: margins are respectable, but returns on equity and assets trail many peers. Growth indicators are also mixed, with strong multi-year revenue-per-share expansion and book value growth, but weaker free cash flow and only moderate recent momentum.
Growth
Trustmark operates in a sector that is mature rather than high-growth, but regional banking can still grow through loan expansion, market share gains, fee income growth, and better balance-sheet pricing. In that sense, the company is in a steady-demand industry rather than a fast-expanding one. Households need deposits, businesses need credit, and wealth and insurance services can deepen customer relationships over time.
Its strategy appears sensible for that environment. Trustmark combines conventional community banking with higher-value fee businesses such as insurance and wealth management, which can reduce reliance on interest spreads alone. The bank also has exposure to attractive southern markets, particularly Texas and Florida, where population and business activity have generally been stronger than the national average over time. For a regional bank, this geographic mix can be a useful long-term support.
Earnings per share have generally moved upward since 2022, with a noticeable recovery through 2024 and 2025. That trend suggests management has been able to rebuild profitability after the sharp pressure that affected many banks when funding costs rose. It does not point to explosive growth, but it does indicate improving earnings power.
Book value per share has also climbed over the last few years after a dip in 2022. For banks, that is an important sign because it shows the company has been adding to shareholder equity over time. Trustmark’s five-year book value per share growth is slightly ahead of the sector median, which supports the view that internal capital generation has been constructive.
A meaningful catalyst is the company’s ability to continue repricing loans and deposits in a more stable rate environment. If deposit competition eases while loan yields remain healthy, net interest income can improve without requiring unusually fast balance-sheet growth. Another possible support is expansion in noninterest revenue from insurance and wealth management, which tends to be less balance-sheet intensive than lending.
Recent company updates have also pointed to continued operating execution rather than a dramatic strategic shift. That is often important for a regional bank: the opportunity is less about one major breakthrough and more about disciplined underwriting, deposit retention, expense control, and steady market expansion in stronger local economies.
Risks
This article is for informational purposes only and does not constitute financial advice. Some content is AI-generated. See Disclaimer


