Stock Analysis · Trinity Capital Inc (TRIN)
Overview
Trinity Capital Inc. is a specialized finance company focused on lending to growth-stage businesses, especially venture-backed companies. It operates as a business development company, or BDC, which means it provides capital to private companies and, in return, passes through most of its taxable income to shareholders as dividends. In simple terms, Trinity sits between startups that need funding and public market investors looking for exposure to private-company lending.
The company mainly earns money from interest and fee income tied to its lending activities. Based on recent annual disclosures, the business is still overwhelmingly centered on debt financing rather than equity gains or other fee streams. Its revenue mix can be summarized approximately as follows:
- Interest income from debt investments: about 85% to 90% — income from equipment financing, secured loans, and other credit facilities provided to portfolio companies.
- Fee income and related structuring income: about 5% to 10% — origination fees, prepayment fees, and other charges connected to underwriting and managing loans.
- Dividend income, warrant gains, and other investment income: about 5% to 10% — returns from equity-linked positions, warrants, and realized or unrealized gains when portfolio companies perform well.
Within its portfolio, Trinity has historically emphasized equipment finance and asset-based lending to venture-backed firms. That positioning matters because these loans are often backed by business assets and can be less speculative than pure equity exposure to startups. The model aims to combine recurring interest income with upside from warrants and select equity participation.
Over the last several years, the business has shown a sharp rebound after a difficult 2022. Revenue and net income recovered strongly in 2023 and 2024, then continued higher in 2025. At the same time, interest expense has also grown, which is important because Trinity uses leverage to fund part of its portfolio.
The operating picture has improved meaningfully since the 2022 downturn: revenue is well above prior levels, profitability has recovered, and administrative costs remain relatively contained compared with total income. The key trade-off is that a larger portfolio has come with higher funding costs and balance-sheet leverage.
Key Figures
| Metric | Value | Sector ⓘ |
|---|---|---|
| Date | Oct 17, 2026 | |
| Context | ||
| Sector | Financial Services | |
| Industry | Asset Management | |
| Market Cap ⓘ | $1.50B | |
| Beta ⓘ | 0.70 | |
Value (Cheapness) | ||
| P/E Ratio ⓘ | 9.60 | 12.26 |
| P/B Ratio ⓘ | 1.19 | 1.23 |
| FCF Yield ⓘ | -14.42% | 10.40% |
| Dividend Yield ⓘ | 12.06% | 3.02% |
| EBIT / EV ⓘ | N/A | 8.14% |
| PEG ⓘ | 5.14 | |
Growth (Business expansion) | ||
| Revenue Growth ⓘ | 19.30% | 9.35% |
| RPS Growth (5Y CAGR) ⓘ | -12.41% | 12.19% |
| EPS Growth (5Y CAGR) ⓘ | -17.31% | -9.53% |
| BVPS Growth (5Y CAGR) ⓘ | -0.94% | 4.99% |
| Margin Growth (5Y Trend) ⓘ | 7.75% | -3.86% |
| FCF Growth (5Y CAGR) ⓘ | N/A | 4.81% |
| DPS Growth (5Y CAGR) ⓘ | 21.09% | 8.79% |
Quality (Business durability) | ||
| ROIC (Latest) ⓘ | N/A | 9.49% |
| ROE (Latest) ⓘ | 14.82% | 13.90% |
| ROA (Latest) ⓘ | 6.64% | 1.55% |
| ROIC (5Y Median) ⓘ | 10.82% | 7.86% |
| ROE (5Y Median) ⓘ | 14.36% | 12.17% |
| ROA (5Y Median) ⓘ | 6.37% | 1.30% |
| Net Debt / EBIT (Latest) ⓘ | N/A | 0.96 |
| Net Debt / EBIT (5Y Median) ⓘ | 4.08 | 0.73 |
| Net Debt / EBITDA (Latest) ⓘ | 6.23 | 0.92 |
| Operating Margin (Latest) ⓘ | N/A | 22.30% |
| Operating Margin (5Y Median) ⓘ | 85.32% | 24.63% |
| Debt to Equity (Latest) ⓘ | 118.27% | 58.56% |
| Profit Margin (Latest) ⓘ | 45.15% | 26.57% |
| Free Cash Flow (Latest) ⓘ | -$216.50M | |
Momentum (Price trend) | ||
| 3Y Return ⓘ | +78.68% | +88.33% |
| 12M Return (excl. last month) ⓘ | +30.29% | +19.38% |
| 6M Return ⓘ | +12.61% | +4.75% |
| Price vs. 200-Day MA ⓘ | +5.08% | +3.50% |
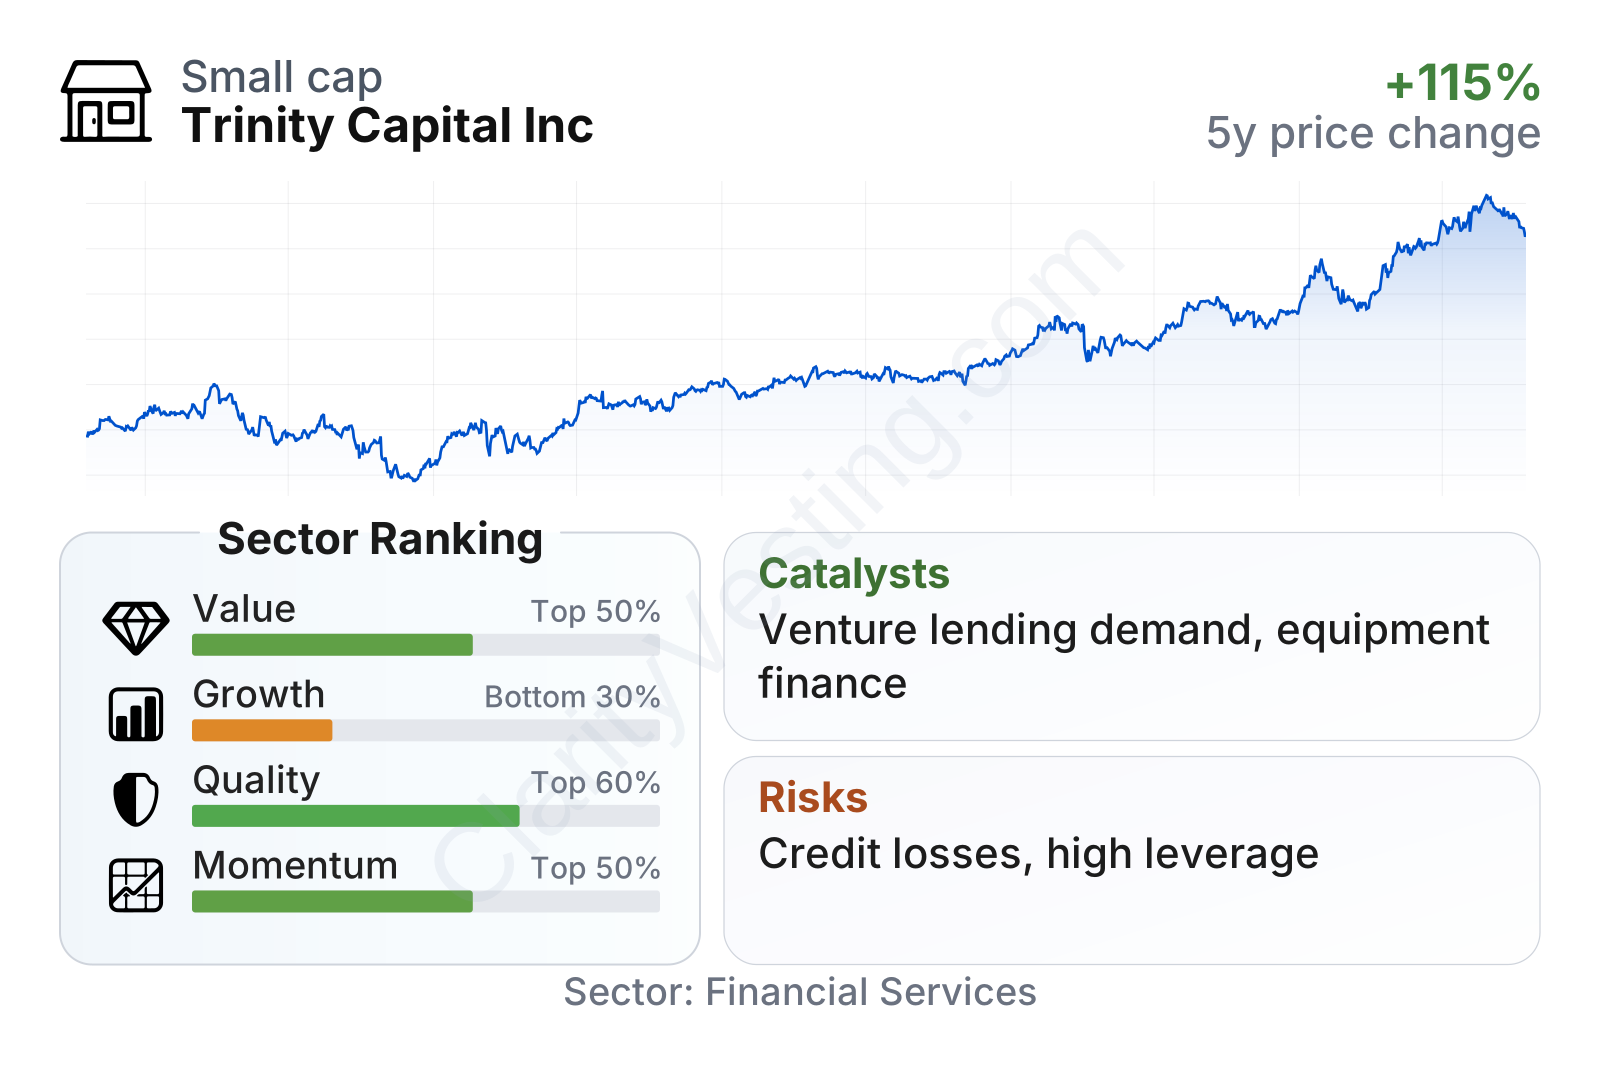
Trinity is a mid-sized financial company with a market value around $1.6 billion and a below-market beta of 0.67, which suggests its share price has been less volatile than the broader market. On valuation, the stock trades at a price-to-earnings ratio near 10, below the sector median, while the price-to-book ratio is slightly above Trinity’s own book value but still below the sector median. Income is a major part of the profile: the trailing dividend yield is around 11.7%, far above the sector median.
The broader factor profile is mixed but understandable for a BDC. Quality and momentum rank in the upper half of the sector, helped by strong profitability metrics and solid recent share performance. Value also looks acceptable on earnings, though that is offset by negative free cash flow and a high PEG ratio. Growth ranks weaker because long-term per-share growth has been uneven, even though recent year-over-year revenue growth has been strong.
Growth
Trinity operates in a part of finance that can grow when venture-backed and innovation-driven companies need alternatives to traditional bank lending. That area has become more relevant since banks have generally been more selective with credit, especially for earlier-stage or higher-growth borrowers. This creates room for specialized lenders that understand equipment finance, asset-backed structures, and startup risk.
Its strategy broadly makes sense for future expansion. Trinity is not trying to compete head-on with large commercial banks across every loan category. Instead, it focuses on a narrower segment where underwriting expertise, speed, and industry relationships matter. For a lender in this niche, growth is supported by three things: a larger originations pipeline, stable credit quality, and access to funding at reasonable costs.
A useful sign is that recent revenue growth has been strong, roughly 19% year over year, clearly above the sector median. Earnings per share, however, show a more mature pattern than a fast-scaling one. After rising from 2021 through 2023, EPS has stayed near the low $2 range in 2024 and 2025, which suggests the company has been expanding but not converting all of that expansion into faster per-share earnings growth.
The earnings pattern points to a business that is producing substantial income but is also absorbing higher funding costs and portfolio-related fluctuations. For long-term analysis, that makes portfolio quality and underwriting discipline just as important as top-line growth.
Book value per share also matters for BDCs because it gives a rough sense of the underlying value of the investment portfolio after liabilities. Trinity’s book value per share fell after 2021, then stabilized and improved again by 2025. That stabilization is helpful because it suggests that portfolio marks and retained earnings have become more supportive after the earlier reset.
One recent opportunity is Trinity’s continued push into equipment finance and sponsored lending relationships, which can broaden deal flow while keeping the company inside its area of expertise. If venture lending remains healthy and private companies continue to prefer non-bank capital providers, Trinity could benefit from a favorable supply-demand setup. Another support factor is its ability to pair recurring interest income with selective warrant upside, giving it some participation when borrowers grow beyond the loan relationship.
Risks
This article is for informational purposes only and does not constitute financial advice. Some content is AI-generated. See Disclaimer


