Stock Analysis · Texas Pacific Land Corporation (TPL)
Overview
Texas Pacific Land Corporation is a landowner and royalty company centered on the Permian Basin in West Texas, one of the most important oil and gas regions in the United States. Unlike a traditional exploration and production company, TPL generally does not drill wells itself. Instead, it owns large tracts of land, receives royalties when other operators produce oil and gas on that land, sells and manages water-related services used in drilling and completion activity, and earns fees from easements, rights-of-way, and other land uses.
This structure matters because it gives TPL a business model with very limited capital needs compared with most energy companies. When activity on its acreage is strong, more of each dollar of revenue can flow through to profit and cash generation. That helps explain why the company has produced unusually high margins for the sector.
Based on recent company reporting, TPL’s revenue is mainly generated from the following sources, listed from largest to smallest:
- Oil and gas royalties: approximately 65% to 75% of revenue. This includes royalty interests tied to oil and natural gas production by third-party operators on TPL acreage.
- Water sales and services: approximately 20% to 30% of revenue. This covers produced-water handling, recycled water, fresh water, and related infrastructure and service activity supporting drilling and completions.
- Surface-related revenue and other: approximately 5% to 10% of revenue. This includes easements, rights-of-way, commercial leases, land use agreements, and other smaller land-based income streams.
The mix can change from quarter to quarter depending on oil and gas output, commodity prices, drilling activity, and the timing of water and surface agreements. Over time, the key point is that royalties remain the economic engine, while water and surface businesses broaden the cash flow base around the same land position.
The long-term pattern is favorable: revenue has risen meaningfully over the last several years, while costs have stayed low relative to sales. That has allowed operating income and net income to remain very strong, which is unusual even within energy.
Key Figures
| Metric | Value | Sector ⓘ |
|---|---|---|
| Date | Nov 14, 2026 | |
| Context | ||
| Sector | Energy | |
| Industry | Oil & Gas E&P | |
| Market Cap ⓘ | $18.94B | |
| Beta ⓘ | 0.58 | |
Value (Cheapness) | ||
| P/E Ratio ⓘ | 32.27 | 13.07 |
| P/B Ratio ⓘ | 10.78 | 1.89 |
| FCF Yield ⓘ | 3.00% | 8.26% |
| Dividend Yield ⓘ | 0.84% | 3.50% |
| EBIT / EV ⓘ | 3.95% | 9.02% |
| PEG ⓘ | 7.33 | |
Growth (Business expansion) | ||
| Revenue Growth ⓘ | 34.60% | 26.55% |
| RPS Growth (5Y CAGR) ⓘ | 15.65% | 6.66% |
| EPS Growth (5Y CAGR) ⓘ | 1.23% | -6.30% |
| BVPS Growth (5Y CAGR) ⓘ | 22.65% | 5.85% |
| Margin Growth (5Y Trend) ⓘ | -3.81% | 0.61% |
| FCF Growth (5Y CAGR) ⓘ | 18.15% | 3.10% |
| DPS Growth (5Y CAGR) ⓘ | 15.05% | 16.92% |
Quality (Business durability) | ||
| ROIC (Latest) ⓘ | 35.97% | 11.29% |
| ROA (Latest) ⓘ | 32.54% | 6.18% |
| ROIC (5Y Median) ⓘ | 41.95% | 10.35% |
| ROA (5Y Median) ⓘ | 39.89% | 5.46% |
| Net Debt / EBIT (Latest) ⓘ | -0.48 | 1.60 |
| Net Debt / EBIT (5Y Median) ⓘ | -0.90 | 1.82 |
| Net Debt / EBITDA (Latest) ⓘ | -0.44 | 0.97 |
| Net Debt / Assets ⓘ | -17.82% | 16.42% |
| EBITDA / Interest ⓘ | N/A | 9.71 |
| Operating Margin (Latest) ⓘ | 75.89% | 16.44% |
| Operating Margin (5Y Median) ⓘ | 80.36% | 20.55% |
| Debt to Equity (Latest) ⓘ | 0.85% | 49.13% |
| Profit Margin (Latest) ⓘ | 60.71% | 9.96% |
| Free Cash Flow (Latest) ⓘ | $569.09M | |
Momentum (Price trend) | ||
| 3Y Return ⓘ | +63.38% | +56.67% |
| 12M Return (excl. last month) ⓘ | +17.93% | +46.57% |
| 6M Return ⓘ | -24.63% | -3.01% |
| Price vs. 200-Day MA ⓘ | -26.70% | +1.29% |
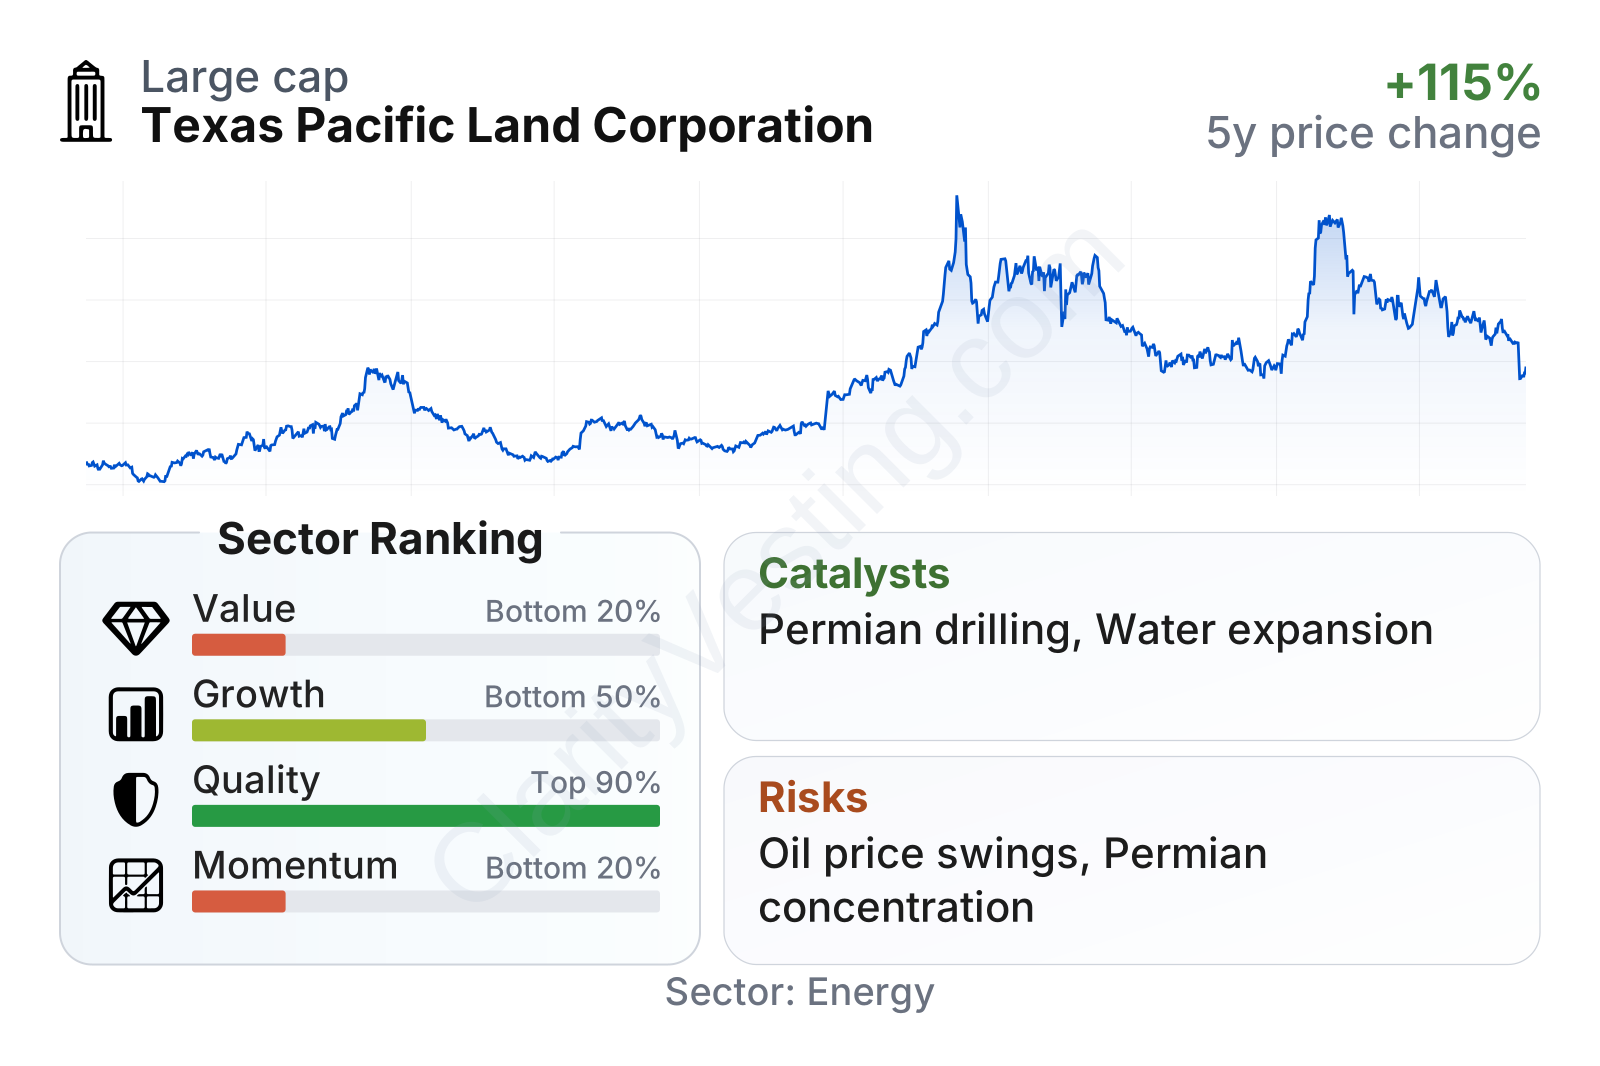
TPL stands out for business quality more than for conventional cheapness. It ranks near the top of the sector on profitability and capital efficiency, supported by returns on capital and assets far above industry norms. The balance sheet is also exceptionally conservative, with almost no leverage and net cash rather than meaningful net debt. On growth, the picture is mixed but still solid: recent revenue growth has been ahead of the sector median, and free cash flow has compounded well over several years, although market momentum has been weak lately. Valuation is the main tradeoff, with earnings, book value, and cash flow multiples all sitting well above typical sector levels.
Growth
TPL operates in a sector that is mature overall, but its core geography is more attractive than the industry average. The Permian Basin remains the leading U.S. shale region because of its large resource base, extensive infrastructure, and generally better economics than many competing basins. As long as producers continue directing capital toward the Permian, TPL can benefit without having to fund drilling programs itself.
The company’s strategy also makes sense for long-term expansion because it builds around assets it already controls. More drilling on TPL acreage can increase royalty volumes. At the same time, water infrastructure can grow alongside development intensity, creating an additional source of recurring revenue tied to the same operating footprint. That combination gives TPL two linked growth channels: hydrocarbon production on its land and service activity that supports that production.
Recent revenue trends show a clear reacceleration. After a softer period in 2023, growth turned positive again and strengthened through 2024, 2025, and into 2026, reaching levels above the sector median. That suggests the company is benefiting from a combination of stronger operating activity, higher royalty-related income, and continued contribution from water and land-based operations.
Cash generation has also remained robust. Free cash flow has moved higher over the last several years, with the latest trailing figure around the mid-hundreds of millions of dollars. For a company with limited capital intensity, that is an important feature: it means TPL can preserve financial flexibility while still funding infrastructure, dividends, and opportunistic capital returns.
A meaningful catalyst is the continued industrialization of produced-water management in the Permian. As drilling and completion activity scale, operators increasingly need reliable sourcing, recycling, transportation, and disposal solutions. TPL’s land position gives it a natural advantage in placing water infrastructure where customers already operate. Another catalyst is simple but powerful: if production on its acreage keeps rising, TPL can capture upside through royalties without taking on the drilling risk borne by operators.
Recent company updates have also pointed to continued activity across its acreage and ongoing development of water-related capabilities. That does not remove cyclicality, but it supports the idea that TPL is not just passively collecting royalties; it is also trying to deepen its role in the local operating ecosystem.
Risks
This article is for informational purposes only and does not constitute financial advice. Some content is AI-generated. See Disclaimer