Stock Analysis · TPG Telecom Limited (TPGTF)
Overview
TPG Telecom Limited is one of Australia’s largest telecommunications groups. It sells mobile phone plans, fixed broadband, business connectivity, data and network services, and related telecom infrastructure access. The company operates consumer brands such as Vodafone, TPG, iiNet, AAPT, Internode, Lebara, and felix, giving it exposure to both value-focused and mainstream parts of the market.
The business mainly earns money from recurring subscription-style telecom services rather than one-time hardware sales. Based on recent company reporting, revenue is broadly concentrated in the following areas:
- Mobile service revenue: approximately 40% to 45% of total revenue. This includes postpaid and prepaid mobile plans for consumers and businesses, plus related usage and service fees.
- Fixed broadband and consumer fixed-line services: approximately 25% to 30%. This includes NBN broadband, home internet, and legacy fixed-line products sold through brands such as TPG and iiNet.
- Enterprise, government, and wholesale: approximately 20% to 25%. This covers corporate connectivity, voice, network solutions, managed services, and wholesale access sold to other telecom providers and institutional customers.
- Handsets, devices, and other revenue: approximately 5% to 10%. This includes device sales and smaller ancillary items.
That mix matters because telecom services tend to produce steady cash generation, but they also require large and continuous investment in spectrum, mobile networks, and customer retention. Over the last several years, TPG Telecom has shown a business profile with fairly stable revenue around the low-to-mid A$5 billion range, improving gross profit in earlier years, and some swings in reported earnings due to costs, depreciation, financing, and one-off items rather than dramatic changes in customer demand alone.
Its market position is important in the Australian telecom market: it is not the largest operator, but it is one of the few scaled national players. That gives it strategic relevance in a market where infrastructure costs are high and where having enough customers to spread network costs is a major advantage.
The multi-year profit flow shows a business with relatively steady revenue but changing profitability. Gross profit improved from 2021 through 2024 as direct costs fell, yet net income was much more volatile, including a loss in 2024 before a rebound in 2025. That pattern suggests the core service base is fairly resilient, while final earnings remain sensitive to non-operating items, depreciation, and financing effects.
Key Figures
| Metric | Value | Sector ⓘ |
|---|---|---|
| Date | Oct 24, 2026 | |
| Context | ||
| Sector | Communication Services | |
| Industry | Telecom Services | |
| Market Cap ⓘ | $5.85B | |
| Beta ⓘ | 0.09 | |
Value (Cheapness) | ||
| P/E Ratio ⓘ | 149.00 | 17.77 |
| FCF Yield ⓘ | N/A | 14.45% |
| Dividend Yield ⓘ | 6.38% | 2.73% |
| EBIT / EV ⓘ | 4.52% | 4.63% |
| PEG ⓘ | N/A | |
Growth (Business expansion) | ||
| Revenue Growth ⓘ | -0.70% | 5.50% |
| RPS Growth (5Y CAGR) ⓘ | -2.54% | 4.55% |
| EPS Growth (5Y CAGR) ⓘ | N/A | -17.45% |
| Margin Growth (5Y Trend) ⓘ | -4.05% | 0.81% |
| FCF Growth (5Y CAGR) ⓘ | 18.20% | 5.63% |
| DPS Growth (5Y CAGR) ⓘ | 13.30% | 5.09% |
Quality (Business durability) | ||
| ROIC (Latest) ⓘ | N/A | 8.51% |
| ROIC (5Y Median) ⓘ | 0.31% | 8.16% |
| Net Debt / EBIT (Latest) ⓘ | N/A | 2.00 |
| Net Debt / EBIT (5Y Median) ⓘ | N/A | 2.83 |
| Net Debt / EBITDA (Latest) ⓘ | N/A | 1.22 |
| Net Debt / Assets ⓘ | 8.88% | 18.70% |
| EBITDA / Interest ⓘ | N/A | 8.31 |
| Operating Margin (Latest) ⓘ | N/A | 15.53% |
| Operating Margin (5Y Median) ⓘ | 1.30% | 13.39% |
| Debt to Equity (Latest) ⓘ | N/A | 59.59% |
| Profit Margin (Latest) ⓘ | 8.64% | 8.77% |
| Free Cash Flow (Latest) ⓘ | N/A | |
Momentum (Price trend) | ||
| 3Y Return ⓘ | +43.28% | +48.95% |
| 12M Return (excl. last month) ⓘ | +40.88% | +1.03% |
| 6M Return ⓘ | -10.19% | +0.56% |
| Price vs. 200-Day MA ⓘ | -5.53% | +1.63% |
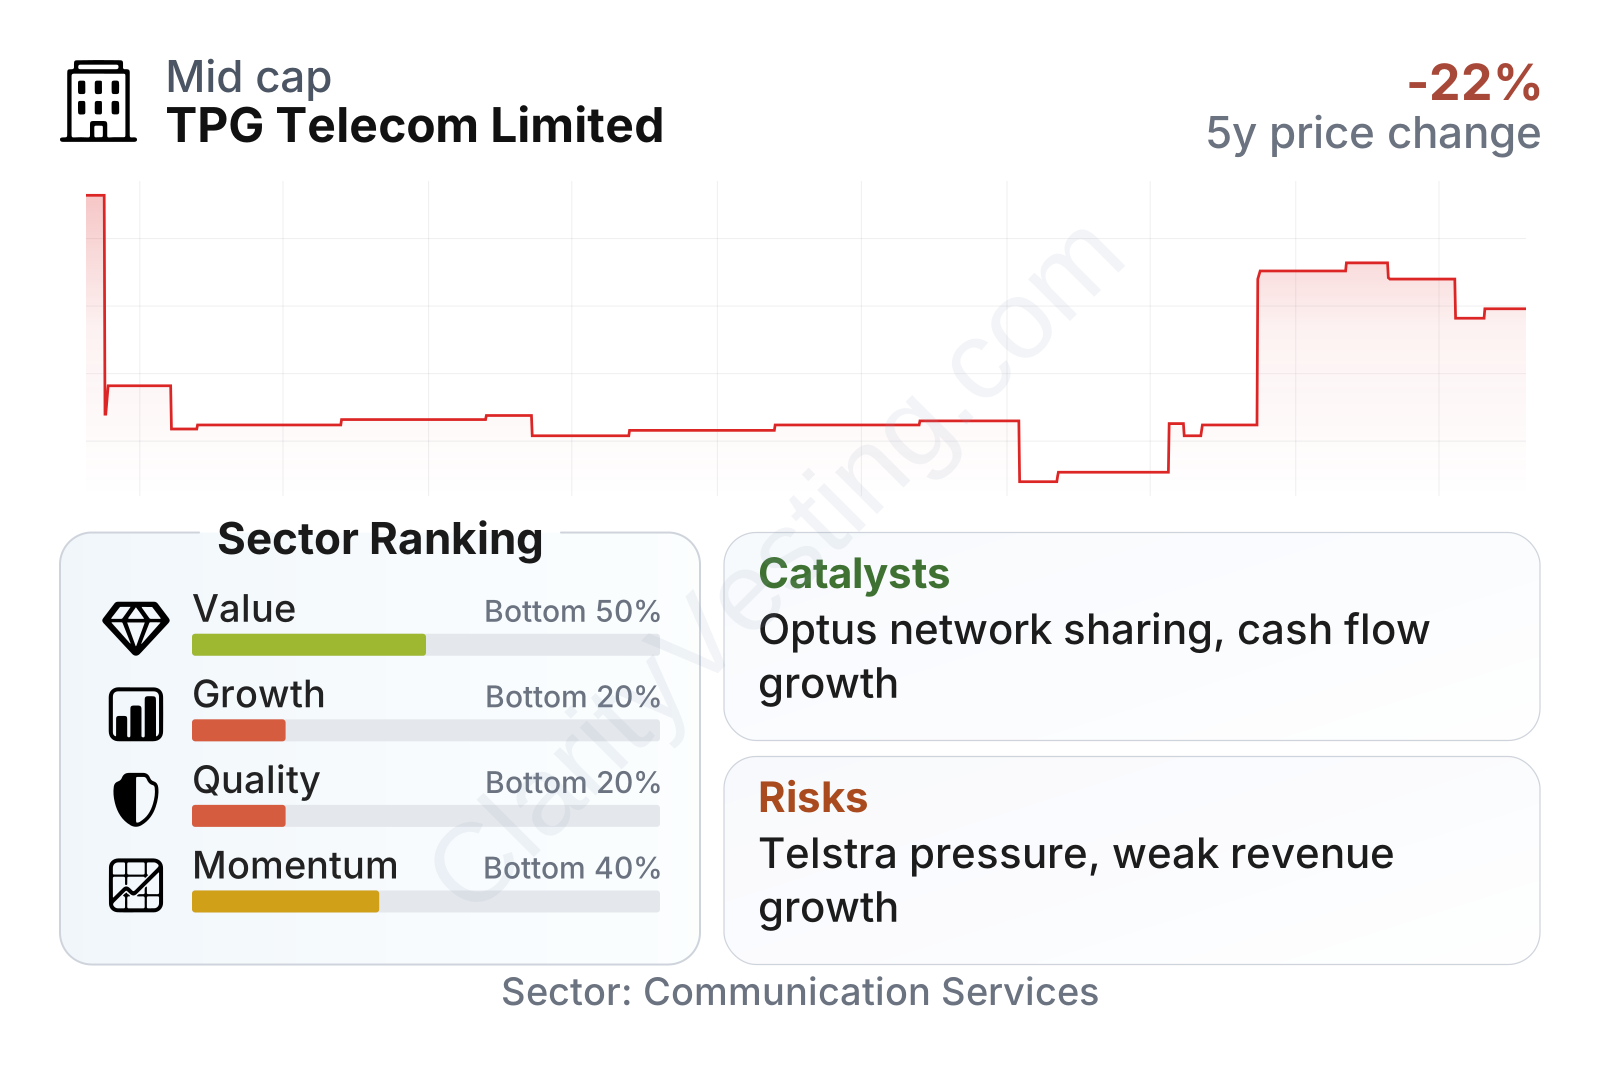
TPG Telecom sits in the mid-sized range by market value and has shown unusually low share-price volatility, with a beta close to zero. The stock’s longer-term price path was weak after 2021, then improved sharply over the last year before softening in the most recent months.
On valuation, the picture is mixed. The headline P/E ratio is very high versus the sector median, which usually means the accounting profit base is currently depressed or distorted rather than the market assigning extreme optimism. By contrast, dividend yield is notably above the sector median, and EBIT relative to enterprise value looks close to the industry norm. In simple terms, the stock does not look obviously cheap on earnings, but it also does not look disconnected from the cash-generating profile typical of a mature telecom operator.
Growth metrics are the weakest part of the profile. Revenue was slightly down year over year, and five-year revenue per share has declined, placing the company in the lower end of the sector on top-line expansion. At the same time, free cash flow and dividends have grown at a much faster pace than sector medians over five years. That combination points to a business that has been getting better at turning a mature revenue base into shareholder distributions, even without strong sales growth.
Balance-sheet risk appears manageable. Net debt compared with assets is lower than the sector median, which is a helpful trait in a capital-intensive industry. Profit margin is roughly in line with the sector, so the company does not stand out as exceptionally profitable, but neither does it look structurally weak on that measure alone.
Growth
TPG Telecom operates in a sector that is mature in basic connectivity but still supported by long-term demand growth in mobile data, digital services, business networking, and higher-capacity fixed broadband. In other words, the Australian telecom market is not a rapid-growth arena in the way software or semiconductors can be, but it remains essential infrastructure with recurring demand. That can still create attractive long-term economics if a company expands margins, lifts average revenue per user, controls churn, and invests intelligently in network quality.
The company’s strategy broadly fits that logic. TPG Telecom has been focusing on extracting value from its multi-brand portfolio, improving network coverage and quality, deepening mobile penetration, and managing costs. Its national mobile presence through Vodafone is particularly important because mobile remains one of the more attractive parts of telecom, with higher customer stickiness and opportunities to bundle services.
A major strategic catalyst is the network-sharing arrangement with Optus in regional Australia, which has the potential to improve TPG Telecom’s mobile coverage without the same level of standalone capital intensity that full duplication would require. Better coverage can strengthen customer acquisition and retention, especially against Telstra’s long-standing network advantage outside major cities. If execution is successful, this can improve the competitiveness of the Vodafone brand and support service revenue over time.
Another growth support is the company’s ability to convert operating performance into cash flow. Even though revenue growth has been modest to negative recently, free cash flow has expanded strongly over a five-year period. For a telecom operator, that matters because network businesses are often judged not only on revenue growth, but also on how efficiently they monetize infrastructure and sustain dividends after capital spending.
Recent company communications have also emphasized ongoing spectrum, network, and digital-platform investments. These initiatives do not guarantee rapid expansion, but they do make strategic sense in a market where service quality, distribution efficiency, and brand segmentation can gradually lift returns even when industrywide subscriber growth is moderate.
Risks
This article is for informational purposes only and does not constitute financial advice. Some content is AI-generated. See Disclaimer


