Stock Analysis · TPG Inc (TPG)
Overview
TPG Inc is a global alternative asset manager. In simple terms, it raises money from institutions and wealthy clients, invests that capital across different strategies, and earns fees for managing those investments. Its platform spans private equity, impact investing, credit, real estate, market solutions, and other specialized strategies. The business model is different from a traditional bank or insurer: TPG mainly makes money from managing other people’s capital, while also investing some of its own balance sheet alongside clients.
Its revenue mix can move sharply from year to year because some parts are recurring and others depend on investment exits or market conditions. Based on recent company reporting, the most important recurring earnings base is management fees, while the more volatile pieces are performance-related revenues and investment income. A practical way to think about TPG’s sources of revenue is:
- Management and advisory fees: approximately 50% to 60% of total revenue in recent periods. This is the steadier part of the business and is earned for overseeing client capital across private equity, credit, impact, real estate, and multi-strategy funds.
- Performance allocations and incentive income: approximately 20% to 30%. This comes from strong fund performance and realized gains when investments are sold or revalued favorably.
- Investment income: approximately 15% to 25%. This reflects returns on TPG’s own invested capital and can be more volatile than management fees.
- Other revenue: generally a small residual portion, including transaction, monitoring, or other fund-related items depending on the period.
That structure matters for long-term analysis. The larger TPG’s fee-paying assets become, the more predictable the business can look. At the same time, reported earnings can remain uneven because realizations, carried interest, and mark-to-market movements are naturally cyclical in alternative asset management.
The operating pattern over the last several years shows that revenue can swing widely, but margins improved meaningfully again in 2025 after a weaker stretch in 2022 through 2024. That suggests TPG remains highly geared to fundraising conditions, investment exits, and asset values rather than following a smooth earnings path.
Over the period shown, revenue and operating income were highly volatile rather than steadily compounding. The 2025 rebound stands out as a strong recovery after much weaker profitability in 2022 to 2024, which is typical for an alternative asset manager exposed to realizations and valuation cycles.
Key Figures
| Metric | Value | Sector ⓘ |
|---|---|---|
| Date | Oct 03, 2026 | |
| Context | ||
| Sector | Financial Services | |
| Industry | Asset Management | |
| Market Cap ⓘ | $17.24B | |
| Beta ⓘ | 1.45 | |
Value (Cheapness) | ||
| P/E Ratio ⓘ | 65.87 | 12.60 |
| P/B Ratio ⓘ | 13.26 | 1.23 |
| FCF Yield ⓘ | 5.32% | 10.16% |
| Dividend Yield ⓘ | 5.15% | 2.96% |
| EBIT / EV ⓘ | 6.99% | 7.77% |
| PEG ⓘ | N/A | |
Growth (Business expansion) | ||
| Revenue Growth ⓘ | 110.20% | 9.50% |
| RPS Growth (5Y CAGR) ⓘ | -37.21% | 12.10% |
| EPS Growth (5Y CAGR) ⓘ | 18.38% | -9.45% |
| BVPS Growth (5Y CAGR) ⓘ | -39.15% | 5.01% |
| Margin Growth (5Y Trend) ⓘ | -68.84% | -4.07% |
| FCF Growth (5Y CAGR) ⓘ | -9.15% | 4.96% |
| DPS Growth (5Y CAGR) ⓘ | -31.97% | 8.79% |
Quality (Business durability) | ||
| ROIC (Latest) ⓘ | 22.00% | 9.60% |
| ROE (Latest) ⓘ | 18.36% | 13.84% |
| ROA (Latest) ⓘ | 1.61% | 1.53% |
| ROIC (5Y Median) ⓘ | 1.83% | 7.86% |
| ROE (5Y Median) ⓘ | 14.71% | 12.20% |
| ROA (5Y Median) ⓘ | 1.09% | 1.29% |
| Net Debt / EBIT (Latest) ⓘ | 2.44 | 0.91 |
| Net Debt / EBIT (5Y Median) ⓘ | 1.30 | 0.74 |
| Net Debt / EBITDA (Latest) ⓘ | 2.04 | 0.97 |
| Operating Margin (Latest) ⓘ | 17.96% | 22.12% |
| Operating Margin (5Y Median) ⓘ | 4.51% | 24.39% |
| Debt to Equity (Latest) ⓘ | 241.79% | 60.37% |
| Profit Margin (Latest) ⓘ | 5.09% | 26.62% |
| Free Cash Flow (Latest) ⓘ | $917.48M | |
Momentum (Price trend) | ||
| 3Y Return ⓘ | +70.59% | +89.23% |
| 12M Return (excl. last month) ⓘ | -9.19% | +17.35% |
| 6M Return ⓘ | +17.64% | +10.00% |
| Price vs. 200-Day MA ⓘ | -4.78% | +3.73% |
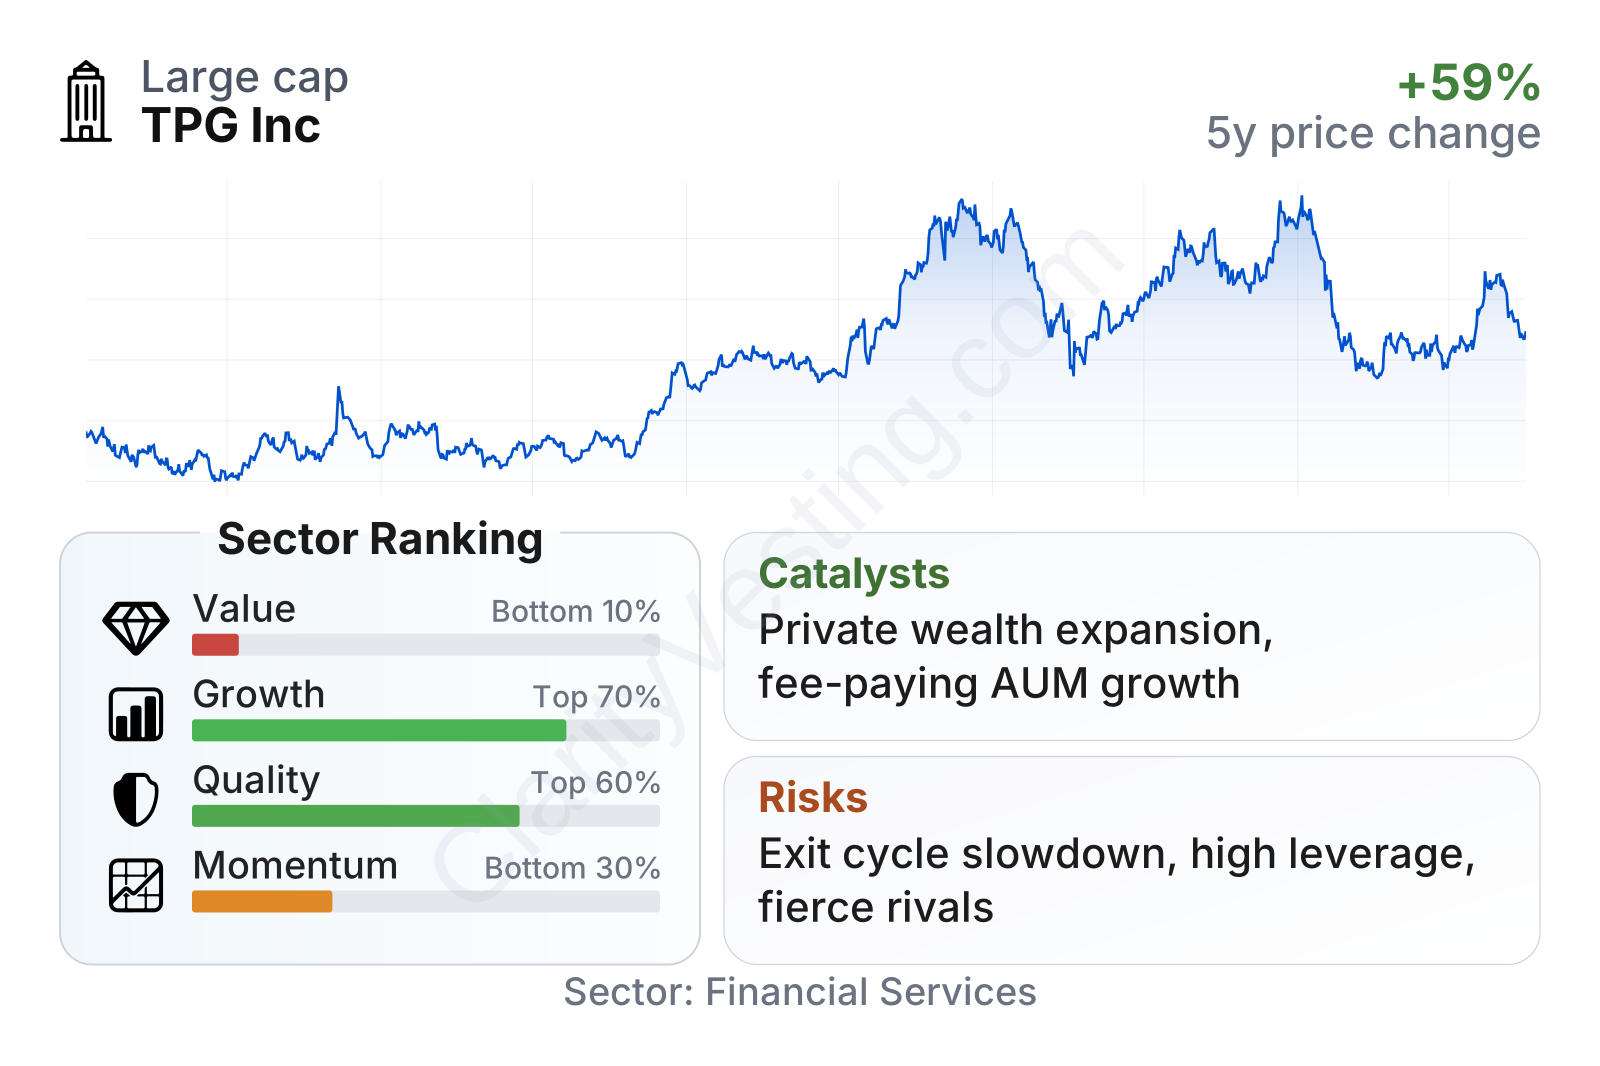
TPG is a large listed alternative asset manager with a market value around the mid-sized range for public financial firms, and its shares have been notably volatile, with a beta well above 1. The stock climbed strongly through 2024 and early 2026, but the path has not been smooth, with sharp pullbacks along the way. In the latest factor snapshot, valuation looks expensive relative to the broader financial sector, quality is above average, growth is mixed, and recent market momentum has weakened.
The most striking feature in the current profile is the gap between strong recent revenue growth and a still-demanding valuation. Profitability metrics such as return on equity and return on invested capital look solid on a trailing basis, but leverage is higher than many peers and margins remain less robust than top-tier asset managers. The dividend yield is relatively high, yet this should be read alongside the company’s variable earnings pattern rather than as a simple sign of cheapness.
Growth
TPG operates in a part of finance that still has structural growth behind it. Large pension funds, sovereign wealth funds, insurers, and affluent investors continue to allocate more money to private markets, credit, infrastructure-like strategies, and alternatives in search of diversification and higher returns. That long-term shift has supported the expansion of firms like TPG, even when fundraising slows temporarily.
TPG’s strategy also makes sense for future growth because it is no longer just a classic private equity manager. Over time it has built a broader platform that includes credit, real estate, impact investing, secondaries, and capital solutions. This is important because diversification can reduce dependence on one fundraising cycle or one exit market. Acquisitions and partnerships in wealth channels and specialized asset classes have also widened the firm’s addressable market.
A key catalyst is fee-paying asset growth. In this industry, raising larger funds and expanding into adjacent strategies can create a durable increase in recurring management fees, which are more dependable than performance income. Another useful driver is normalization in exit markets. If deal activity, IPOs, and asset sales become more active, firms like TPG can unlock carried interest and crystallize gains that have been waiting on the sidelines.
Recent company updates have pointed to continued platform expansion, fundraising activity, and efforts to reach a broader set of clients, including private wealth channels. That is strategically important because private wealth is a large pool of capital that remains underpenetrated in alternatives compared with institutional markets. If TPG executes well there, it could support longer-duration asset gathering beyond the traditional pension and endowment base.
Earnings per share have recovered from the low point seen after 2021, but the pattern is uneven rather than linear. That fits the economics of alternative asset managers: earnings can improve substantially when exits and realizations reopen, but they can also flatten when markets become less cooperative.
Book value per share is not especially helpful here in the same way it would be for a traditional bank. The series has been distorted by accounting and balance-sheet structure, so long-term analysis is usually more meaningful when centered on fee-related earnings power, fundraising progress, and realization activity rather than book value alone.
Risks
This article is for informational purposes only and does not constitute financial advice. Some content is AI-generated. See Disclaimer


