Stock Analysis · Zhong Yang Financial Group Limited (TOP)
Overview
Zhong Yang Financial Group Limited is a Hong Kong-based financial services company focused on securities brokerage and related capital-markets activities. Through its operating subsidiaries, it serves mainly individual and institutional clients that want to trade securities, subscribe to IPOs, finance positions through margin lending, or use other brokerage-related services. In practical terms, it is a small financial intermediary rather than a large diversified bank or asset manager.
The business model is built around client trading activity and financing services. Based on the company’s public filings, revenue is mainly generated from the following areas:
- Brokerage commissions and trading-related fees: revenue from executing trades in Hong Kong and other markets, plus handling charges and settlement-related fees. This is typically one of the company’s largest revenue streams, although the exact mix can shift materially from year to year.
- Margin financing interest income: interest earned when clients borrow against their securities positions. For many small brokerages, this can be a meaningful contributor because it is less transaction-based than pure commission income.
- IPO subscription and financing services: fees and interest tied to clients participating in new stock offerings.
- Other financial services income: this may include underwriting, placing, asset-management-related activity, or ancillary services, but these appear to be smaller and less consistent contributors than brokerage and financing.
Because the latest public filing does not present a clear percentage split in a stable way that can be carried across all periods, it is more reliable to view Zhong Yang as a company whose revenue concentration is heavily tied to brokerage activity and client financing, with smaller contributions from other capital-markets services.
The recent income flow shows a business that was profitable on a modest revenue base a few years ago, then went through a sharp contraction. Revenue fell from roughly $8 million to $10 million levels earlier in the period to about $3 million in fiscal 2025, before recovering toward roughly $5 million in fiscal 2026. That rebound is notable, but profitability has not recovered with it, which means the company is still in a rebuilding phase rather than operating from a position of strength.
The broad picture is a narrow, transaction-sensitive platform: sales recovered from the prior year’s low, but operating costs still consumed too much of that revenue, leaving losses in place.
Key Figures
| Metric | Value | Sector ⓘ |
|---|---|---|
| Date | Oct 17, 2026 | |
| Context | ||
| Sector | Financial Services | |
| Industry | Capital Markets | |
| Market Cap ⓘ | $1.86B | |
| Beta ⓘ | -0.93 | |
Value (Cheapness) | ||
| P/E Ratio ⓘ | N/A | 12.26 |
| P/B Ratio ⓘ | 2.93 | 1.23 |
| FCF Yield ⓘ | 0.39% | 10.40% |
| Dividend Yield ⓘ | N/A | 3.02% |
| EBIT / EV ⓘ | -0.16% | 8.14% |
| PEG ⓘ | N/A | |
Growth (Business expansion) | ||
| Revenue Growth ⓘ | -19.30% | 9.35% |
| RPS Growth (5Y CAGR) ⓘ | -12.64% | 12.19% |
| EPS Growth (5Y CAGR) ⓘ | N/A | -9.53% |
| BVPS Growth (5Y CAGR) ⓘ | 33.56% | 4.99% |
| Margin Growth (5Y Trend) ⓘ | -70.70% | -3.86% |
| FCF Growth (5Y CAGR) ⓘ | 82.96% | 4.81% |
| DPS Growth (5Y CAGR) ⓘ | N/A | 8.79% |
Quality (Business durability) | ||
| ROIC (Latest) ⓘ | N/A | 9.49% |
| ROE (Latest) ⓘ | -19.22% | 13.90% |
| ROA (Latest) ⓘ | -9.91% | 1.55% |
| ROIC (5Y Median) ⓘ | 2.75% | 7.86% |
| ROE (5Y Median) ⓘ | 2.75% | 12.17% |
| ROA (5Y Median) ⓘ | 2.15% | 1.30% |
| Net Debt / EBIT (Latest) ⓘ | N/A | 0.96 |
| Net Debt / EBIT (5Y Median) ⓘ | -4.61 | 0.73 |
| Net Debt / EBITDA (Latest) ⓘ | N/A | 0.92 |
| Operating Margin (Latest) ⓘ | -40.16% | 22.30% |
| Operating Margin (5Y Median) ⓘ | 12.29% | 24.63% |
| Debt to Equity (Latest) ⓘ | 8.42% | 58.56% |
| Profit Margin (Latest) ⓘ | -30.67% | 26.57% |
| Free Cash Flow (Latest) ⓘ | $7.24M | |
Momentum (Price trend) | ||
| 3Y Return ⓘ | -46.52% | +88.33% |
| 12M Return (excl. last month) ⓘ | +136.90% | +19.38% |
| 6M Return ⓘ | +217.56% | +4.75% |
| Price vs. 200-Day MA ⓘ | +66.01% | +3.50% |
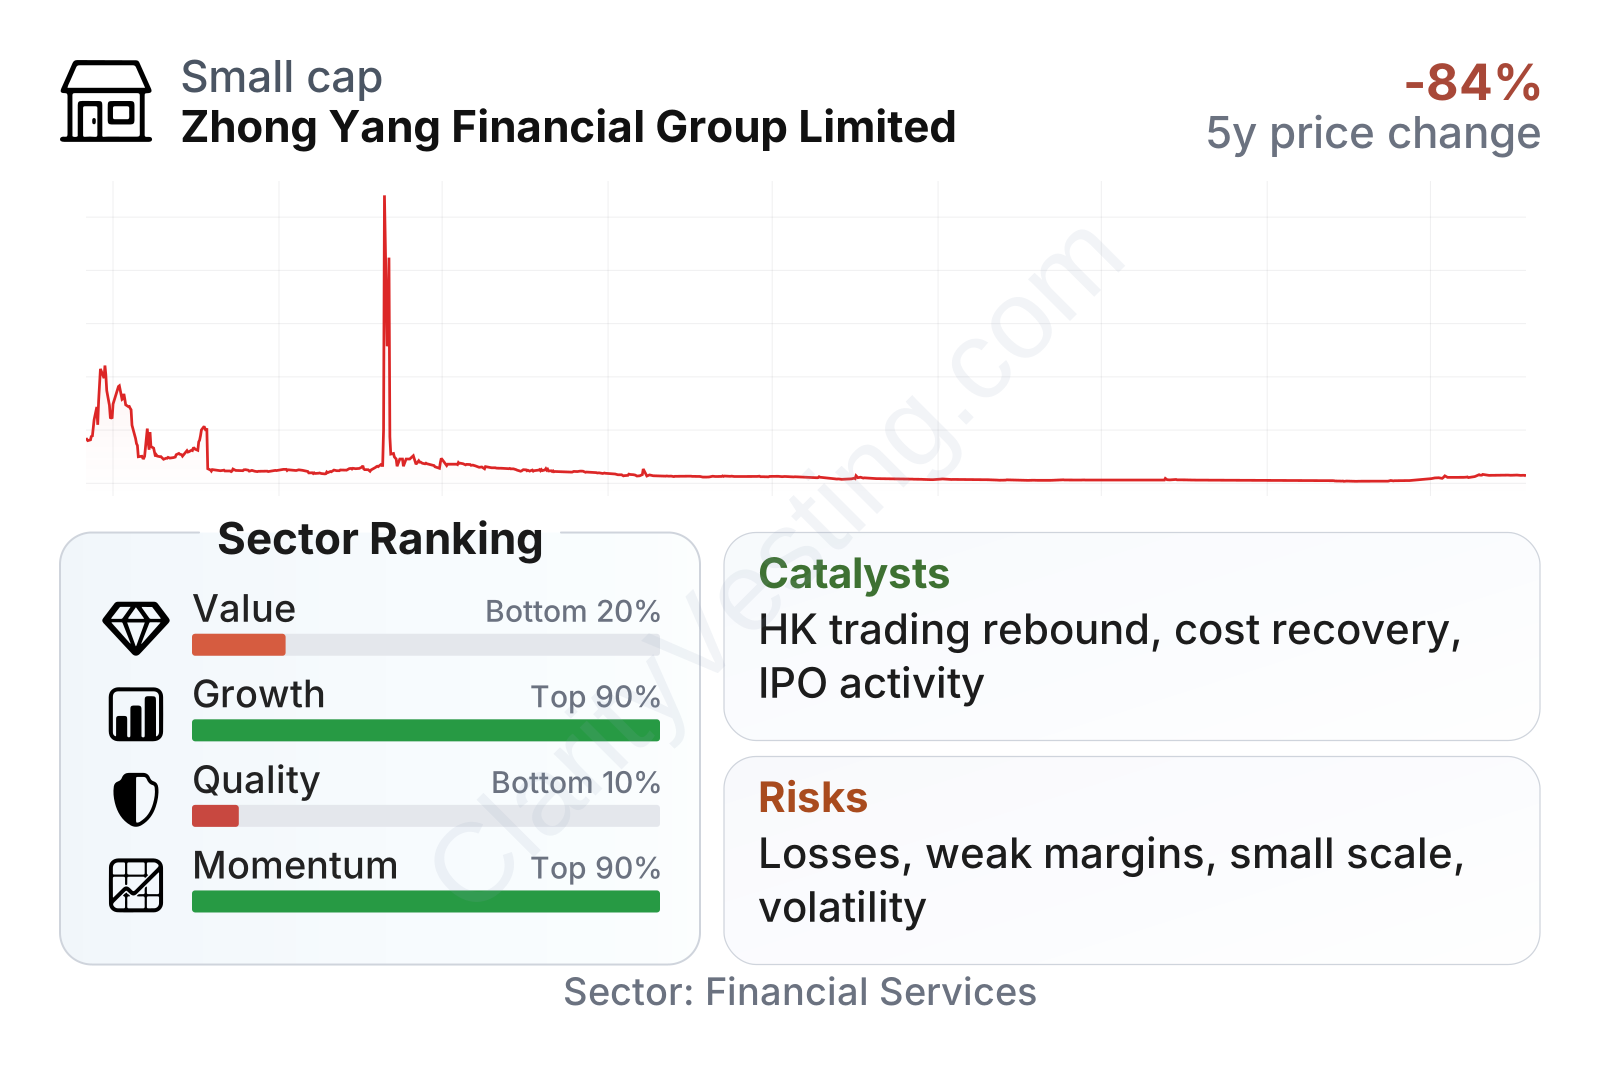
Zhong Yang is a small-capitalization company with unusually volatile share-price behavior. The long-term stock record remains weak, even after a very strong recent surge. That jump in momentum stands out, but it comes against the backdrop of a much lower base after a multi-year decline.
The factor snapshot is mixed in a way that matters for long-term analysis. Growth and momentum rank high relative to much of the sector, but that is largely driven by balance-sheet expansion and recent market action rather than broad operating strength. Value measures look weak, and quality measures are especially soft: returns on equity and assets are negative, operating margin is deeply below the sector median, and free cash flow yield is very low. One positive point is the balance sheet’s low debt burden, with debt to equity around 8%, which reduces financial strain even though earnings remain under pressure.
Growth
Zhong Yang operates in financial services, specifically capital markets and brokerage, which is a structurally relevant sector but not one that guarantees steady growth. Long-term demand for trading access, wealth products, and securities financing should remain in place, especially in Hong Kong’s role as a gateway between mainland China and international capital. The challenge is that this is a highly competitive market, and smaller brokers tend to experience growth in bursts rather than in a smooth upward trend.
The company’s strategy appears logical on paper: offer brokerage access, margin financing, and IPO-related services to capture more revenue per client. That approach can work when market volumes are healthy and investor participation rises. The problem is execution. Recent results show that revenue is still below earlier peak levels, and the business has not yet rebuilt enough scale to cover its cost base consistently.
Earnings are still negative in the most recent quarterly readings, so any growth case today depends more on operational recovery than on established profit compounding. The weak earnings base means even modest improvements in client activity, financing balances, or cost control could have an outsized effect on reported results, but it also means the business has little room for mistakes.
Book value per share has increased sharply over the last five years despite some pullback more recently. That matters for a financial firm because book value is often a rough proxy for franchise stability and capital backing. The rise suggests the company did build net asset value over time, even though recent losses have started to erode part of that progress. In other words, the balance sheet has held up better than the income statement.
A near-term catalyst is simple: if trading conditions improve and the company keeps expenses under tighter control, revenue does not need to return to prior highs for losses to narrow materially. Another possible catalyst is renewed retail activity in Hong Kong equities or stronger IPO issuance, which could lift both commissions and financing demand. The sharp recent stock move also suggests the market has become more attentive to even small operational changes, though that kind of attention can amplify volatility as much as opportunity.
Risks
This article is for informational purposes only and does not constitute financial advice. Some content is AI-generated. See Disclaimer


