Stock Analysis · TriNet Group Inc (TNET)
Overview
TriNet Group Inc is a professional employer organization, often called a PEO. In simple terms, it helps small and mid-sized businesses outsource complex human resources work. Its platform combines payroll processing, employee benefits, tax administration, compliance support, risk management, and HR technology. That makes TriNet less like a traditional staffing company and more like an outsourced HR infrastructure provider for businesses that want enterprise-level HR capabilities without building them internally.
The company’s revenue is mainly tied to the number of worksite employees it serves and the amount spent on payroll-related services and benefits. Based on company reporting, the business is primarily organized around two main sources of revenue.
- Professional service revenues: approximately 85% to 90% of total revenue in recent periods. This is the core PEO business and includes payroll administration, HR services, benefits administration, workers’ compensation-related services, and other employment-related offerings delivered to client companies.
- Insurance service revenues: approximately 10% to 15% of total revenue. This mainly reflects commissions and fees associated with health insurance and other benefit-related programs offered through TriNet’s platform.
That revenue mix matters because the larger professional services segment drives scale, while the insurance-related piece can add value through benefits design and carrier relationships. The broader financial flow also shows an important pattern: revenue has stayed around the $5 billion range in recent years, but a larger share has been absorbed by service delivery and operating costs, which helps explain the drop in operating income and net income since 2023.
Key Figures
| Metric | Value | Sector ⓘ |
|---|---|---|
| Date | Oct 17, 2026 | |
| Context | ||
| Sector | Industrials | |
| Industry | Staffing & Employment Services | |
| Market Cap ⓘ | $3.04B | |
| Beta ⓘ | 0.98 | |
Value (Cheapness) | ||
| P/E Ratio ⓘ | 17.63 | 22.10 |
| P/B Ratio ⓘ | 25.21 | 1.97 |
| FCF Yield ⓘ | 10.71% | 6.38% |
| Dividend Yield ⓘ | 1.69% | 1.94% |
| EBIT / EV ⓘ | 8.42% | 4.79% |
| PEG ⓘ | 7.22 | |
Growth (Business expansion) | ||
| Revenue Growth ⓘ | -4.40% | 9.30% |
| RPS Growth (5Y CAGR) ⓘ | 11.40% | 7.81% |
| EPS Growth (5Y CAGR) ⓘ | -15.46% | -13.06% |
| BVPS Growth (5Y CAGR) ⓘ | -45.92% | 6.14% |
| Margin Growth (5Y Trend) ⓘ | -4.71% | 0.88% |
| FCF Growth (5Y CAGR) ⓘ | 13.94% | 11.01% |
| DPS Growth (5Y CAGR) ⓘ | -38.27% | 9.48% |
Quality (Business durability) | ||
| ROIC (Latest) ⓘ | 19.15% | 10.84% |
| ROA (Latest) ⓘ | 5.17% | 5.41% |
| ROIC (5Y Median) ⓘ | 28.99% | 9.38% |
| ROA (5Y Median) ⓘ | 10.51% | 4.95% |
| Net Debt / EBIT (Latest) ⓘ | 1.96 | 2.08 |
| Net Debt / EBIT (5Y Median) ⓘ | 1.57 | 2.27 |
| Net Debt / EBITDA (Latest) ⓘ | 1.56 | 1.39 |
| Net Debt / Assets ⓘ | 17.69% | 19.28% |
| EBITDA / Interest ⓘ | 7.02 | 9.58 |
| Operating Margin (Latest) ⓘ | 6.18% | 10.50% |
| Operating Margin (5Y Median) ⓘ | 10.15% | 10.29% |
| Debt to Equity (Latest) ⓘ | 760.00% | 65.48% |
| Profit Margin (Latest) ⓘ | 3.63% | 6.67% |
| Free Cash Flow (Latest) ⓘ | $326.00M | |
Momentum (Price trend) | ||
| 3Y Return ⓘ | -41.18% | +61.68% |
| 12M Return (excl. last month) ⓘ | +1.85% | +12.58% |
| 6M Return ⓘ | +79.71% | 0.00% |
| Price vs. 200-Day MA ⓘ | +28.24% | +0.02% |
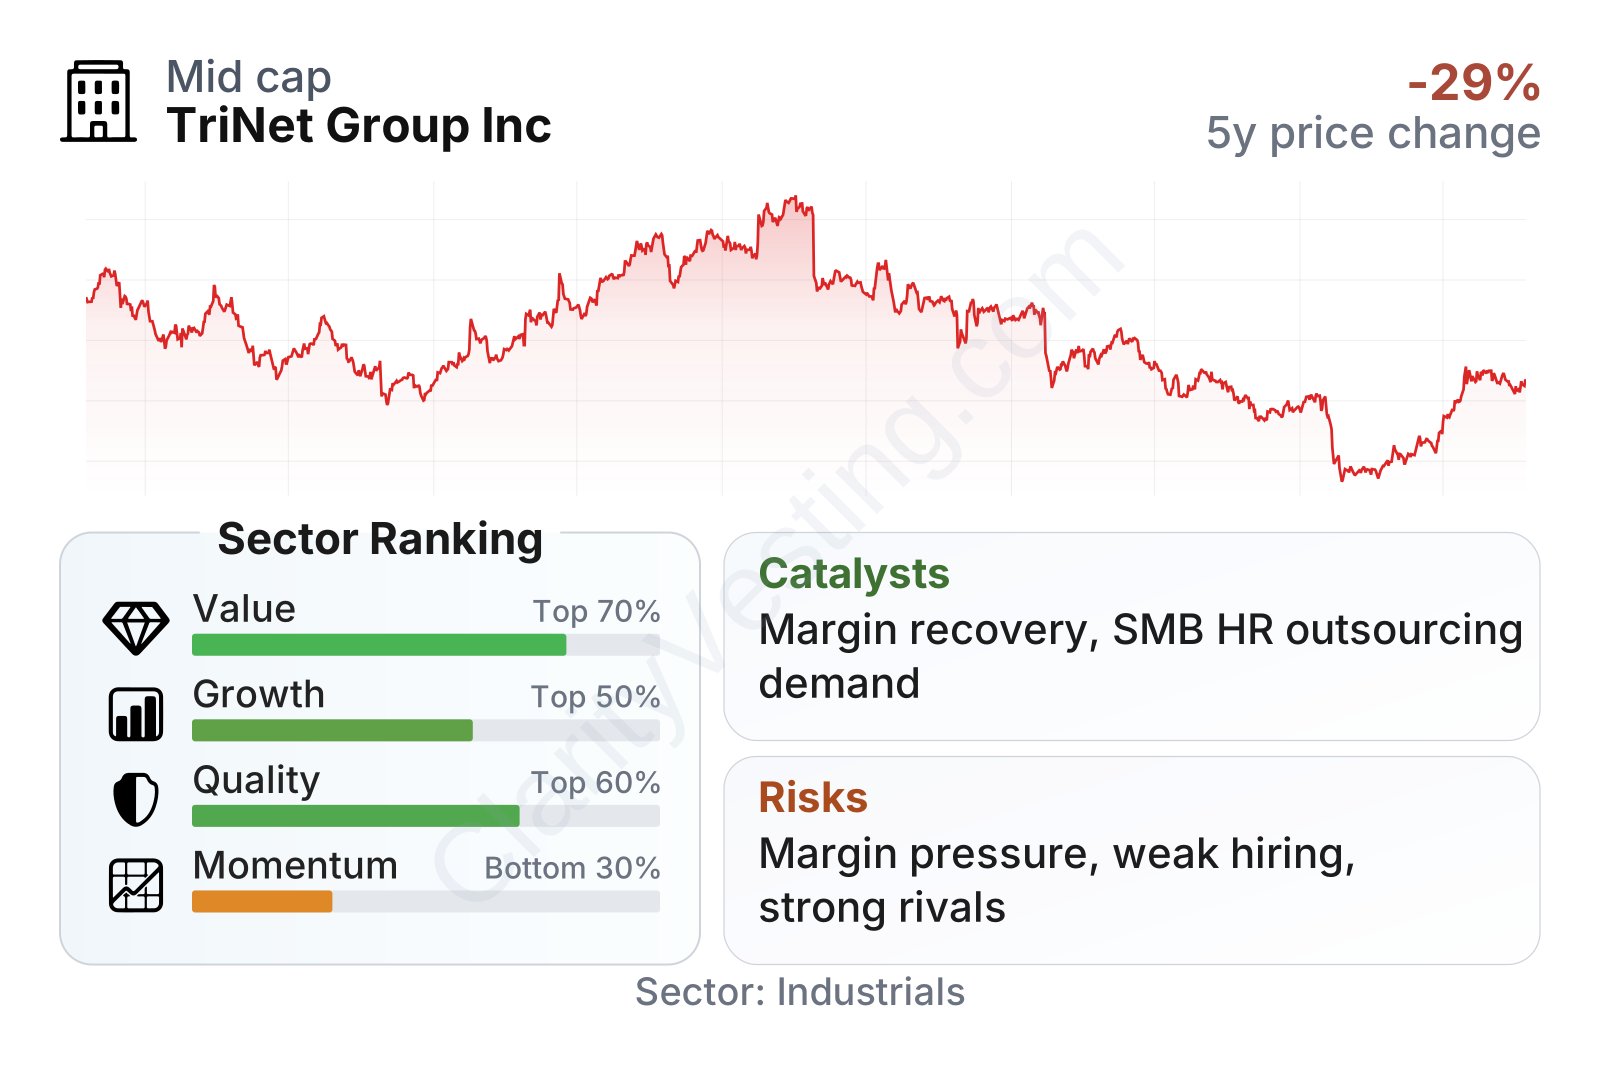
TriNet is a mid-sized public company with a market value of roughly $3 billion and a stock volatility close to the broader market. On valuation, the earnings multiple sits below the sector median, while free cash flow yield and EBIT relative to enterprise value look stronger than many peers. On the other hand, the company’s price-to-book ratio is unusually high because book equity has become very thin, so that metric is less useful here than earnings, cash flow, and debt measures. Profitability and growth indicators are mixed: long-term revenue-per-share growth has been solid, but recent sales growth and margins have weakened, and share-price performance over the last three years has lagged the wider sector despite a sharp rebound in the most recent six months.
Growth
TriNet operates in a part of the market that still has structural room to grow. Small and medium-sized businesses continue to face rising complexity in payroll, benefits, compliance, multi-state employment rules, and talent retention. Those pressures support demand for outsourced HR platforms, especially among firms that want to reduce administrative burden and offer competitive employee benefits. In that sense, the company is positioned in a sector with durable long-term relevance even if short-term hiring activity can fluctuate.
Its strategy also makes business sense. TriNet focuses on industry-specific service models, bundled HR support, and technology that allows clients to manage payroll, benefits, and workforce administration in one place. This can create switching costs because once a client builds HR processes around a PEO platform, changing providers can be disruptive. The company also benefits from scale when negotiating benefits offerings and spreading compliance and technology costs across a broad client base.
The challenge is that near-term growth has softened. Revenue growth was healthy in 2021 and early 2022, then slowed sharply and turned negative more recently. The latest year-over-year readings are around negative 5%, which suggests pressure from client employment trends, pricing dynamics, or both. That does not automatically break the long-term case, but it does show that TriNet is currently in a slower phase than many companies in its sector.
Cash generation remains an important offset. Free cash flow has been volatile, but it remains clearly positive, with trailing twelve-month free cash flow around the low-$300 million range. Over a five-year view, free cash flow growth has outpaced the sector median, which suggests the underlying business still has meaningful cash-producing ability even during a weaker earnings period. For a service-based company, that cash profile matters because it supports debt service, technology investment, and capital returns.
Recent company updates have emphasized product expansion, benefits solutions, and technology improvements rather than a single transformative event. The more realistic catalyst is gradual execution: stabilizing client retention, improving margin discipline, and restoring revenue growth as labor markets and small-business hiring conditions normalize. If those pieces improve together, the operating model can show stronger leverage than recent headline results suggest.
Risks
This article is for informational purposes only and does not constitute financial advice. Some content is AI-generated. See Disclaimer


