Stock Analysis · Tennant Company (TNC)
Overview
Tennant Company is an industrial equipment manufacturer focused on floor cleaning and surface maintenance. Its machines are used in places such as factories, warehouses, retail stores, schools, hospitals, airports, and public venues. The company sells sweepers, scrubbers, extractors, burnishers, and related cleaning technologies, along with parts, consumables, service, and equipment rental or leasing support in some markets. A key part of its positioning is that cleaning is not only about appearance: for customers, it also connects to labor productivity, workplace safety, regulatory compliance, and water and chemical efficiency.
Tennant’s revenue is mainly generated from the sale of cleaning equipment, while recurring revenue comes from aftermarket activities such as parts, consumables, and service. Based on recent annual disclosures, the business mix can be described approximately as follows:
- Equipment sales: about 75% to 80% of revenue. This includes autonomous and conventional floor scrubbers and sweepers sold under Tennant and related brands.
- Parts, consumables, and service: about 20% to 25% of revenue. This includes replacement parts, brushes, pads, detergents, and maintenance support.
- Other revenue streams: a small share of revenue, including items such as rentals, reconditioned equipment, and other customer support activities where applicable.
Geographically, Tennant has a broad international footprint, with North America remaining the largest market, followed by EMEA, Latin America, and Asia-Pacific. That gives the company exposure to multiple end markets, but also means results can be affected by industrial demand, foreign exchange movements, and regional economic conditions.
The long-term financial pattern is mixed. Revenue expanded from roughly $1.09 billion in 2021 to about $1.29 billion in 2024, showing that Tennant can grow when demand and pricing are supportive. However, 2025 was weaker, with revenue falling back to about $1.20 billion. Profitability also moved down sharply after a strong 2023 and a solid 2024, suggesting the business is currently in a less favorable phase than it was two years ago.
The operating picture shows a company that still produces substantial gross profit, but whose bottom-line earnings have become more pressured recently as operating income and net income narrowed after peaking in 2023.
Key Figures
| Metric | Value | Sector ⓘ |
|---|---|---|
| Date | Oct 17, 2026 | |
| Context | ||
| Sector | Industrials | |
| Industry | Specialty Industrial Machinery | |
| Market Cap ⓘ | $1.15B | |
| Beta ⓘ | 1.11 | |
Value (Cheapness) | ||
| P/E Ratio ⓘ | 64.63 | 22.10 |
| P/B Ratio ⓘ | 2.17 | 1.97 |
| FCF Yield ⓘ | -0.25% | 6.38% |
| Dividend Yield ⓘ | 1.82% | 1.94% |
| EBIT / EV ⓘ | 2.53% | 4.79% |
| PEG ⓘ | 1.68 | |
Growth (Business expansion) | ||
| Revenue Growth ⓘ | 1.70% | 9.30% |
| RPS Growth (5Y CAGR) ⓘ | 2.86% | 7.81% |
| EPS Growth (5Y CAGR) ⓘ | -24.78% | -13.06% |
| BVPS Growth (5Y CAGR) ⓘ | 8.91% | 6.14% |
| Margin Growth (5Y Trend) ⓘ | -1.90% | 0.88% |
| FCF Growth (5Y CAGR) ⓘ | -1.61% | 11.01% |
| DPS Growth (5Y CAGR) ⓘ | 6.15% | 9.48% |
Quality (Business durability) | ||
| ROIC (Latest) ⓘ | 2.88% | 10.84% |
| ROA (Latest) ⓘ | 1.45% | 5.41% |
| ROIC (5Y Median) ⓘ | 10.08% | 9.38% |
| ROA (5Y Median) ⓘ | 6.18% | 4.95% |
| Net Debt / EBIT (Latest) ⓘ | 8.53 | 2.08 |
| Net Debt / EBIT (5Y Median) ⓘ | 2.29 | 2.27 |
| Net Debt / EBITDA (Latest) ⓘ | 3.22 | 1.39 |
| Net Debt / Assets ⓘ | 24.70% | 19.28% |
| EBITDA / Interest ⓘ | 7.98 | 9.58 |
| Operating Margin (Latest) ⓘ | 3.02% | 10.50% |
| Operating Margin (5Y Median) ⓘ | 7.93% | 10.29% |
| Debt to Equity (Latest) ⓘ | 73.27% | 65.48% |
| Profit Margin (Latest) ⓘ | 1.50% | 6.67% |
| Free Cash Flow (Latest) ⓘ | -$2.90M | |
Momentum (Price trend) | ||
| 3Y Return ⓘ | -5.37% | +61.68% |
| 12M Return (excl. last month) ⓘ | -13.69% | +12.58% |
| 6M Return ⓘ | +2.05% | 0.00% |
| Price vs. 200-Day MA ⓘ | -12.07% | +0.02% |
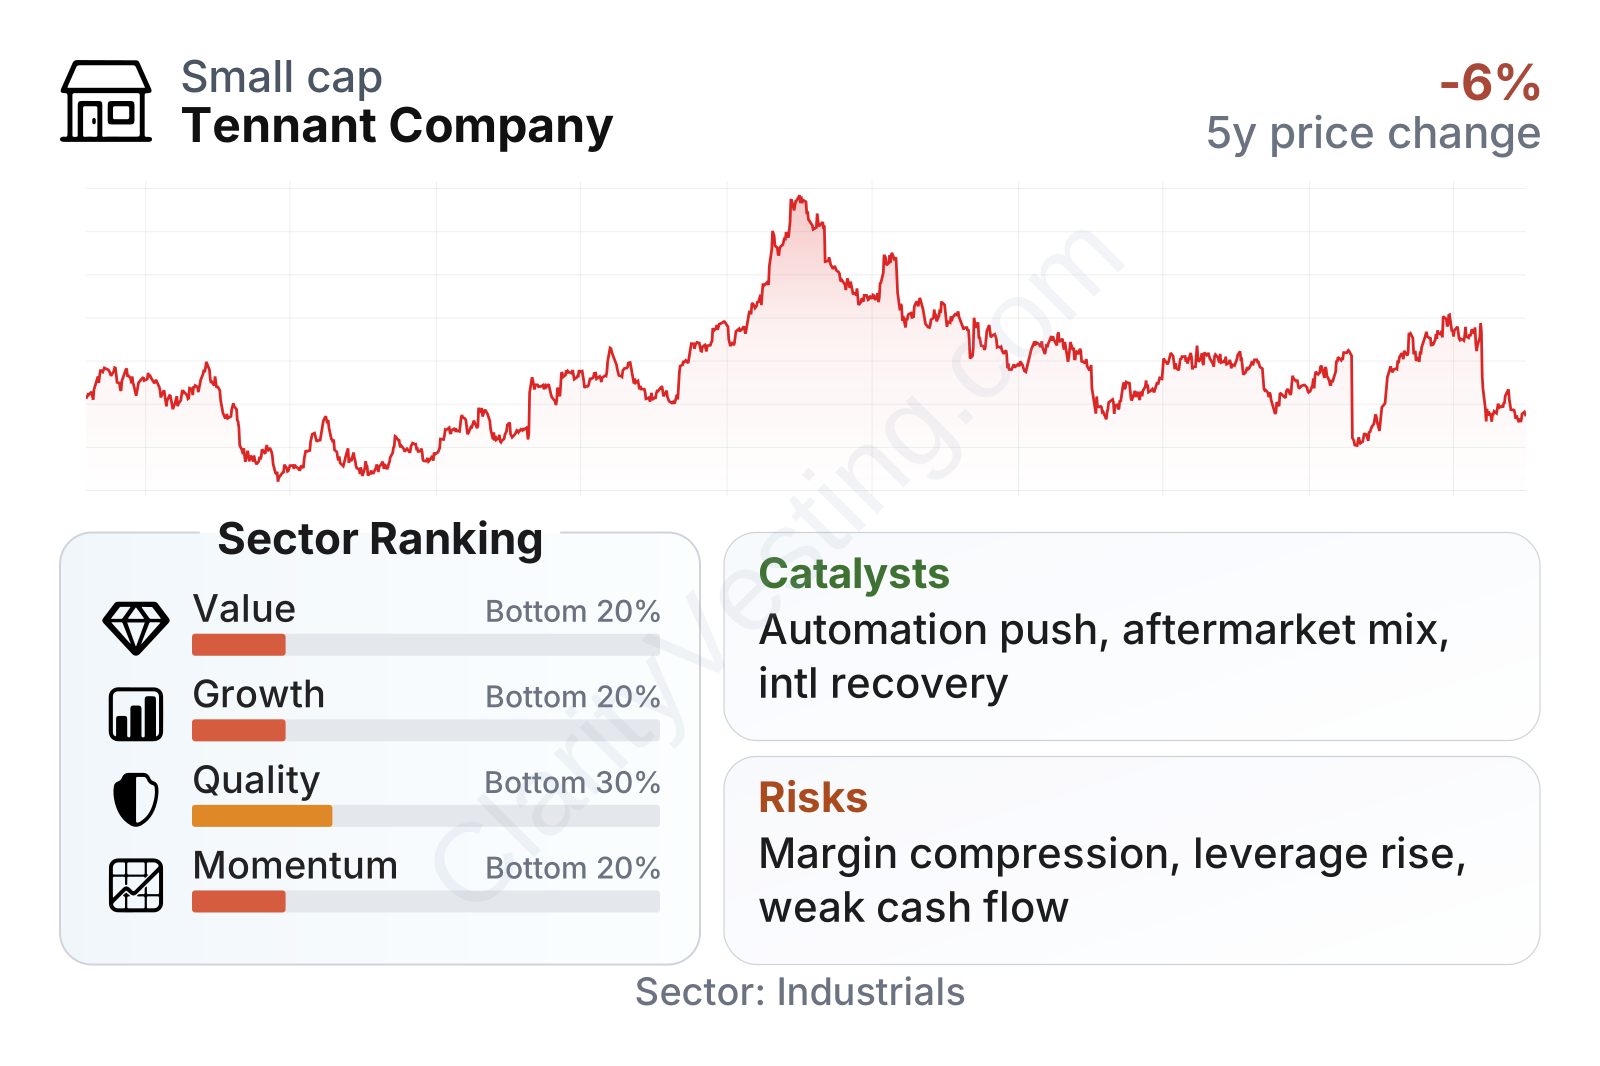
Tennant is a mid-sized industrial company with stock volatility close to the broader market. The latest metric profile is not especially strong: value, growth, quality, and momentum all rank in the lower end of the sector. The main weak points are a high earnings multiple, negative recent free cash flow, slower growth than many industrial peers, and lower current profitability.
The stock chart also reflects that uneven backdrop. After a sharp surge in 2024, the share price gave back much of that move before stabilizing and recovering somewhat in 2026. That kind of pattern usually signals that the market has become less confident in the durability of earnings rather than in the existence of the business itself.
Growth
Tennant operates in a sector that has a reasonable long-term demand base, even if it is not a fast-growing area of the industrial market. Commercial and industrial floor cleaning is supported by recurring needs: buildings must be cleaned regardless of the economic cycle, and labor shortages can push customers toward more automated equipment. On top of that, customers increasingly look for machines that use less water, fewer chemicals, and more data-driven fleet management. Those trends support gradual modernization demand.
Tennant’s strategy broadly fits that direction. The company has been investing in higher-value machines, technology-enabled products, and autonomous cleaning solutions. It has also emphasized aftermarket revenue, which matters because service and parts can be steadier and often more profitable than one-time equipment sales. The logic is sound: if Tennant can place more machines in the field, it can build a larger installed base that later produces service and consumables revenue.
Recent growth, however, has been uneven rather than consistently strong. Tennant posted a very strong run in 2023 and remained positive through 2024, but 2025 turned negative on a year-over-year basis before returning to modest growth in early 2026. That suggests the company is still working through a slowdown rather than entering a clearly accelerated phase.
Cash generation tells a similar story. Free cash flow was strong at one point, then faded materially, and the latest trailing figure has slipped slightly below zero. For a machinery company, that does not automatically signal a structural problem, because working capital can swing with inventories, receivables, and order timing. Still, it does mean that the current recovery case rests more on future normalization than on present cash strength.
A notable catalyst is automation. Tennant has continued developing robotic and autonomous cleaning machines, which can be attractive for labor-constrained customers in logistics, retail, education, and healthcare. Another possible catalyst is the company’s international reach: if demand improves outside North America, Tennant already has channels and service infrastructure in place to benefit. Recent company communications have also highlighted continued attention to productivity, innovation, and commercial execution, which are the right areas to focus on when growth is moderate and margin discipline becomes more important.
Risks
This article is for informational purposes only and does not constitute financial advice. Some content is AI-generated. See Disclaimer


