Stock Analysis · TMX Group Limited (TMXXF)
Overview
TMX Group Limited operates market infrastructure in Canada. In simple terms, it runs important financial marketplaces and related services that help investors trade stocks, derivatives, fixed income products, energy products, and mutual funds. It also provides clearing services, trust and transfer agency services, and market data used by banks, brokers, asset managers, and other financial institutions. Its best-known assets include the Toronto Stock Exchange, the TSX Venture Exchange, the Montréal Exchange, CDS clearing and depository services, Trayport in energy trading technology, and TMX Datalinx for market data.
This is mostly a transaction-and-subscription type business. Some revenue rises with trading activity, while other revenue is recurring because customers pay for listings, data, software, clearing access, and post-trade services. That mix can make the business more resilient than a pure trading venue.
Based on the company’s recent annual reporting structure, the main revenue sources are approximately the following:
- Global Solutions, Insights & Analytics: about 30% to 35% of revenue. This includes market data, analytics, index services, investor solutions, and Trayport’s trading technology for energy markets.
- Capital Formation: about 20% to 25%. This covers listing fees and related services from TSX, TSX Venture Exchange, Alpha, and TSX Trust.
- Derivatives Trading & Clearing: about 15% to 20%. This comes mainly from the Montréal Exchange and related clearing activity.
- Equities and Fixed Income Trading & Clearing: about 15% to 20%. This includes cash equities trading, fixed income activity, and related services.
- Post Trade: about 10% to 15%. This includes clearing, settlement, depository, and related infrastructure services.
- Other revenue: a smaller residual portion tied to corporate services and inter-segment items.
The overall picture is that TMX is not just a stock exchange operator. It is a broad financial infrastructure group with a strong domestic position in Canada and growing exposure to data, analytics, and energy-market technology, which generally carry steadier economics than pure trading volumes.
The long-term trend points to rising revenue and strong cash generation, although reported operating figures can look unusually volatile from year to year because accounting items and business mix changes can distort headline margins. The important takeaway is that TMX has continued to scale revenue while keeping operating leverage attractive.
Key Figures
| Metric | Value | Sector ⓘ |
|---|---|---|
| Date | Nov 21, 2026 | |
| Context | ||
| Sector | Financial Services | |
| Industry | Financial Data & Stock Exchanges | |
| Market Cap ⓘ | $11.90B | |
| Beta ⓘ | 0.05 | |
Value (Cheapness) | ||
| P/E Ratio ⓘ | 28.47 | 12.01 |
| P/B Ratio ⓘ | N/A | 1.48 |
| FCF Yield ⓘ | 7.37% | 8.77% |
| Dividend Yield ⓘ | 2.20% | 3.01% |
| EBIT / EV ⓘ | 23.54% | 8.31% |
| PEG ⓘ | N/A | |
Growth (Business expansion) | ||
| Revenue Growth ⓘ | 17.30% | 6.70% |
| RPS Growth (5Y CAGR) ⓘ | 24.83% | 12.35% |
| EPS Growth (5Y CAGR) ⓘ | -2.37% | -0.27% |
| BVPS Growth (5Y CAGR) ⓘ | 14.19% | 4.83% |
| Margin Growth (5Y Trend) ⓘ | 54.67% | -4.16% |
| FCF Growth (5Y CAGR) ⓘ | 13.33% | 4.69% |
| DPS Growth (5Y CAGR) ⓘ | 17.69% | 8.82% |
Quality (Business durability) | ||
| ROIC (Latest) ⓘ | 48.31% | 9.49% |
| ROE (Latest) ⓘ | 12.67% | 14.02% |
| ROA (Latest) ⓘ | 0.96% | 1.53% |
| ROIC (5Y Median) ⓘ | 23.75% | 7.80% |
| ROE (5Y Median) ⓘ | 9.37% | 12.09% |
| ROA (5Y Median) ⓘ | 0.91% | 1.28% |
| Net Debt / EBIT (Latest) ⓘ | 0.55 | 0.88 |
| Net Debt / EBIT (5Y Median) ⓘ | 0.72 | 0.73 |
| Net Debt / EBITDA (Latest) ⓘ | 0.48 | 0.71 |
| Operating Margin (Latest) ⓘ | 238.63% | 23.37% |
| Operating Margin (5Y Median) ⓘ | 112.88% | 24.29% |
| Debt to Equity (Latest) ⓘ | 57.61% | 59.34% |
| Profit Margin (Latest) ⓘ | 30.56% | 26.65% |
| Free Cash Flow (Latest) ⓘ | $877.43M | |
Momentum (Price trend) | ||
| 3Y Return ⓘ | +112.18% | +73.29% |
| 12M Return (excl. last month) ⓘ | +10.64% | +18.35% |
| 6M Return ⓘ | +9.08% | +3.24% |
| Price vs. 200-Day MA ⓘ | +14.68% | +2.17% |
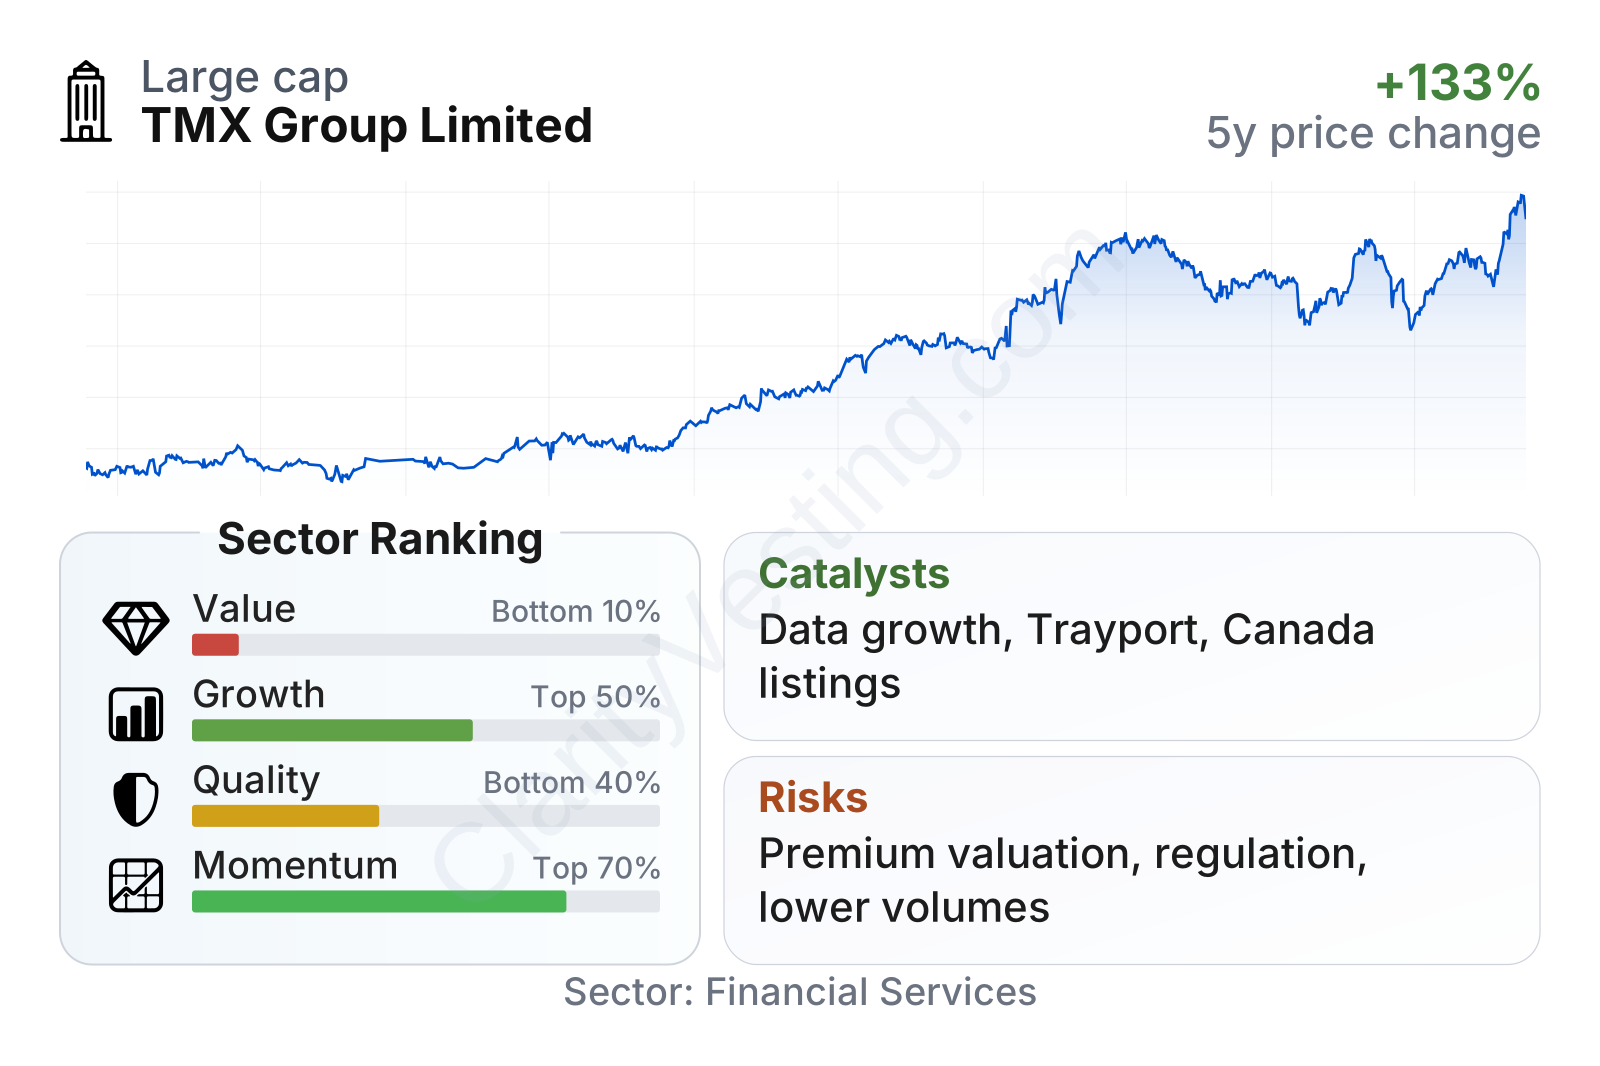
TMX stands out as a large, low-volatility company in its sector, with an unusually low beta and a strong multi-year share price climb. On growth, it compares favorably with much of the sector: revenue growth, free cash flow expansion, dividend growth, and book value growth have all been strong over five years. Quality is more mixed. Profitability and cash conversion are solid, and leverage remains modest, but return on equity and return on assets have generally trailed the sector median. On valuation, the shares screen as expensive on earnings multiples, while free cash flow yield and dividend yield are not especially high. In short, the market appears to be paying up for stability, infrastructure quality, and recurring revenue.
Growth
TMX operates in a sector that benefits from several durable trends: more electronic trading, rising demand for market data, tighter regulation that favors established infrastructure providers, and steady demand for index, analytics, and post-trade services. These are not short-lived themes. Financial markets need trusted exchanges, clearing systems, and data networks, and those functions tend to become more valuable as markets become more digital and interconnected.
The company’s strategy also fits that backdrop well. Over time, TMX has expanded beyond traditional exchange fees into data, software, and workflow tools. That matters because these activities can be less cyclical than transaction-based revenue and often carry stronger retention. Trayport is especially important here because it gives TMX exposure to European and global energy trading workflows, broadening the group outside Canada and outside cash equities.
Another positive point is operating leverage. Exchange and market infrastructure businesses often have high fixed costs, so additional volume or new recurring subscriptions can translate into solid profit growth once the platform is built. TMX’s five-year trends in revenue per share, free cash flow, and dividend growth suggest that this operating model has been working, even though earnings per share has been uneven in reported form.
The earnings pattern has not been smooth, which is worth noticing. Recent trailing earnings have rebounded sharply after a period of lower reported EPS, indicating that headline profit can move around because of one-time items, financing effects, or accounting noise. For a business like TMX, that makes cash flow, recurring revenue mix, and segment development more informative than a single year’s earnings figure alone.
Book value per share has risen strongly over the last several years, noticeably faster than the sector median. That suggests the company has been adding balance-sheet value while continuing to invest in its platforms and services. Combined with double-digit revenue growth in the latest year and a long runway in market data and post-trade services, this supports the view that TMX is positioned in a structurally growing niche rather than a stagnant one.
A meaningful catalyst is Canada’s central role in mining and energy listings, where TMX has longstanding franchise strength. If capital raising activity improves, listing and issuer services can add another growth layer on top of recurring data and clearing revenue. The company also continues to benefit from demand for energy-market software and analytics, an area where customers often rely on deeply embedded systems.
Risks
This article is for informational purposes only and does not constitute financial advice. Some content is AI-generated. See Disclaimer