Stock Analysis · Thermo Fisher Scientific Inc (TMO)
Overview
Thermo Fisher Scientific is one of the largest suppliers of tools, equipment, chemicals, software, and services used across the life sciences and healthcare ecosystem. Its customers include pharmaceutical and biotechnology companies, hospitals and clinical labs, academic researchers, industrial companies, and government agencies. In simple terms, the company helps scientists discover new drugs, helps labs run tests, and helps manufacturers produce complex biologic medicines.
The business is diversified across several operating segments, which reduces dependence on any single product line. Based on the latest annual reporting structure, revenue is mainly generated from the following sources:
- Laboratory Products and Biopharma Services: approximately 39% of revenue. This includes laboratory equipment, consumables, chemicals, safety products, and a broad set of biopharma services such as clinical research support and pharmaceutical development and manufacturing services.
- Analytical Instruments: approximately 24% of revenue. This segment sells instruments used to analyze materials and biological samples, including chromatography, mass spectrometry, electron microscopy, and related software and services.
- Specialty Diagnostics: approximately 20% of revenue. This covers diagnostic test kits, immunoassay systems, transplant diagnostics, microbiology, and healthcare market channels.
- Life Sciences Solutions: approximately 17% of revenue. This segment includes reagents, biosciences tools, genetic analysis, gene expression products, cell culture media, and other inputs used in research and bioproduction.
The overall mix matters because a large share of sales comes from repeat purchases such as consumables, services, and regulated workflows rather than one-time equipment orders alone. That tends to support steadier demand over time. The company also operates at global scale and owns many well-known brands, which strengthens its position in laboratories and production environments where switching costs can be meaningful.
Over the last several years, revenue surged during the pandemic period, then normalized, while profitability remained solid. More recently, gross profit and net income have stabilized and operating discipline appears to have improved, helped by lower selling and administrative costs relative to the post-pandemic reset.
Key Figures
| Metric | Value | Sector ⓘ |
|---|---|---|
| Date | Oct 24, 2026 | |
| Context | ||
| Sector | Healthcare | |
| Industry | Diagnostics & Research | |
| Market Cap ⓘ | $256.61B | |
| Beta ⓘ | 0.88 | |
Value (Cheapness) | ||
| P/E Ratio ⓘ | 36.60 | 25.42 |
| P/B Ratio ⓘ | 4.58 | 3.08 |
| FCF Yield ⓘ | 2.96% | 3.12% |
| Dividend Yield ⓘ | N/A | 1.85% |
| EBIT / EV ⓘ | 3.03% | 0.56% |
| PEG ⓘ | 1.98 | |
Growth (Business expansion) | ||
| Revenue Growth ⓘ | 10.50% | 7.50% |
| RPS Growth (5Y CAGR) ⓘ | 4.59% | 8.60% |
| EPS Growth (5Y CAGR) ⓘ | -6.38% | -17.73% |
| BVPS Growth (5Y CAGR) ⓘ | 8.33% | 3.72% |
| Margin Growth (5Y Trend) ⓘ | -4.42% | -0.57% |
| FCF Growth (5Y CAGR) ⓘ | -2.70% | 0.96% |
| DPS Growth (5Y CAGR) ⓘ | 14.11% | 6.69% |
Quality (Business durability) | ||
| ROIC (Latest) ⓘ | 8.59% | 3.17% |
| ROA (Latest) ⓘ | 6.31% | 2.98% |
| ROIC (5Y Median) ⓘ | 9.69% | 4.56% |
| ROA (5Y Median) ⓘ | 6.49% | 1.87% |
| Net Debt / EBIT (Latest) ⓘ | 4.46 | 1.34 |
| Net Debt / EBIT (5Y Median) ⓘ | 3.40 | 1.86 |
| Net Debt / EBITDA (Latest) ⓘ | 3.19 | 1.00 |
| Net Debt / Assets ⓘ | 31.43% | 5.06% |
| EBITDA / Interest ⓘ | 7.31 | 9.55 |
| Operating Margin (Latest) ⓘ | 18.62% | 9.25% |
| Operating Margin (5Y Median) ⓘ | 19.49% | 7.33% |
| Debt to Equity (Latest) ⓘ | 75.54% | 26.68% |
| Profit Margin (Latest) ⓘ | 15.04% | 3.34% |
| Free Cash Flow (Latest) ⓘ | $7.60B | |
Momentum (Price trend) | ||
| 3Y Return ⓘ | +47.92% | +51.61% |
| 12M Return (excl. last month) ⓘ | +39.13% | +19.90% |
| 6M Return ⓘ | +31.86% | +10.10% |
| Price vs. 200-Day MA ⓘ | +23.40% | +6.44% |
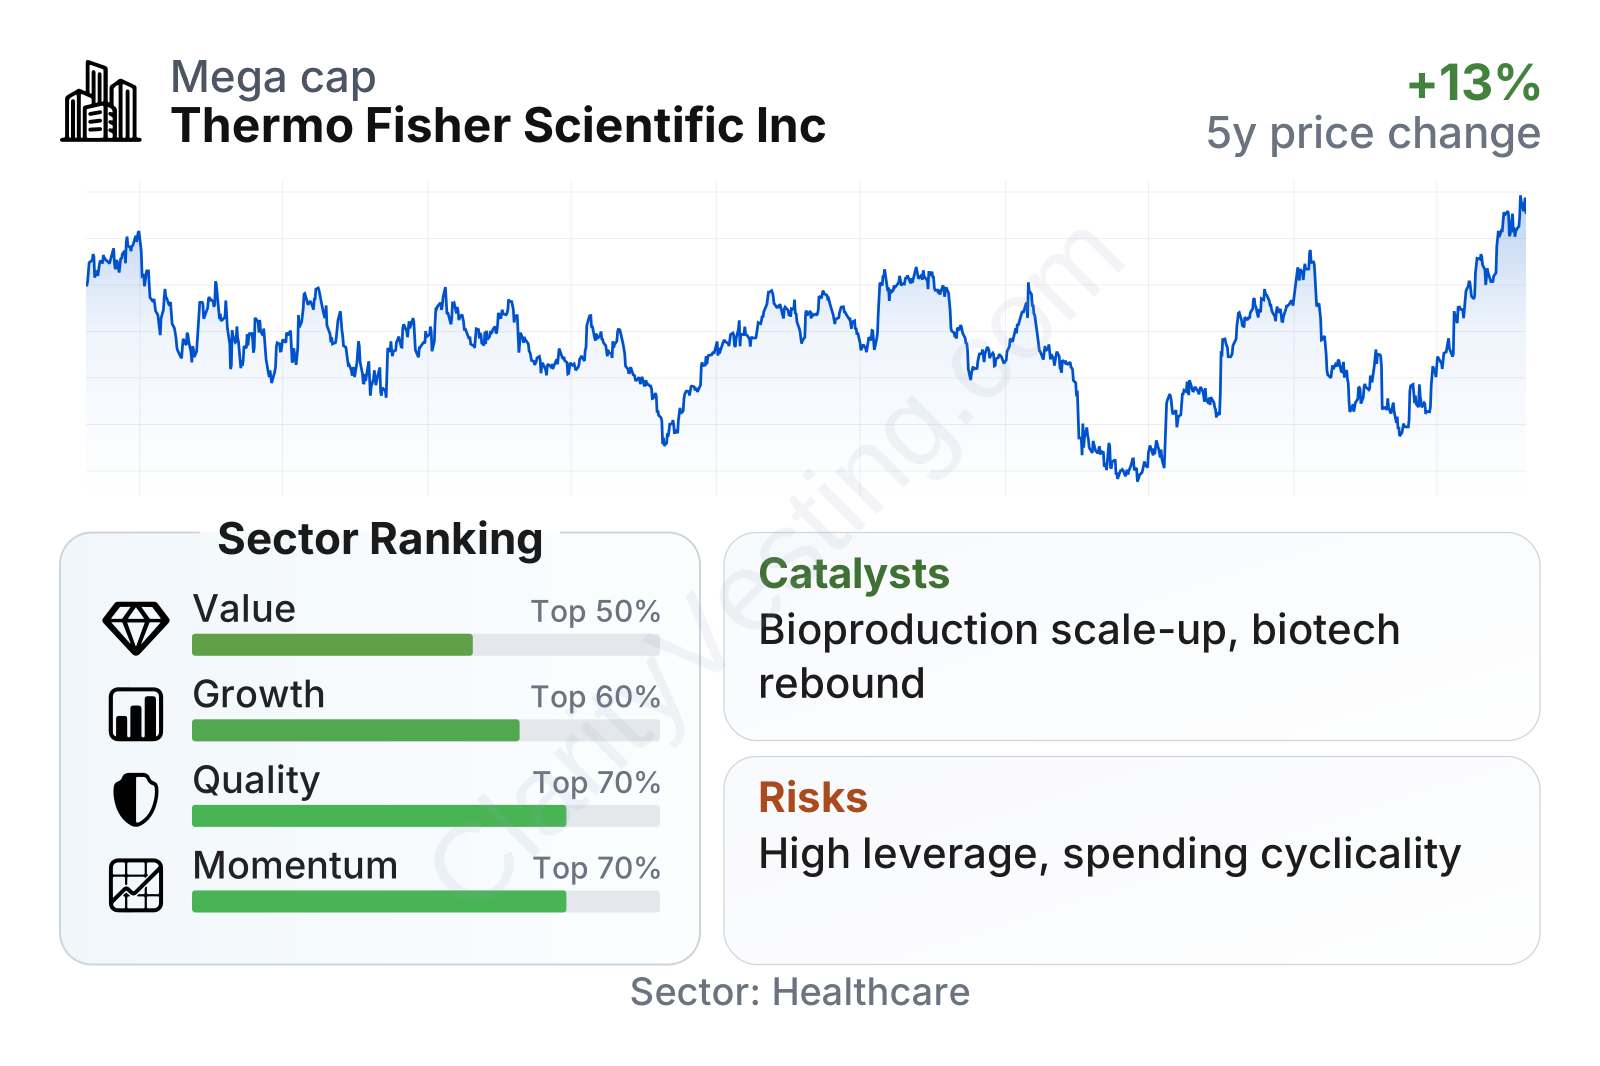
Thermo Fisher stands out as a very large healthcare company with below-market volatility, which often reflects the defensive nature of its end markets. Profitability and returns on capital remain clearly above sector medians, while recent share-price momentum has been strong. The main offset is valuation: multiples are above typical healthcare peers, and balance-sheet leverage is higher than many companies in the sector.
The stock-price history shows a business that benefited from exceptional pandemic-era demand, then went through a reset as that temporary revenue faded. Even with that volatility, the shares recovered meaningfully from the 2025 lows, suggesting that the market has been refocusing on the company’s underlying earnings power rather than only on the post-COVID decline.
Growth
Thermo Fisher operates in markets that should continue expanding over the long run: biologic drugs, cell and gene therapy, precision medicine, clinical testing, advanced diagnostics, and laboratory automation. These are not niche themes. They are tied to rising research spending, aging populations, more complex therapies, and the growing need to analyze large volumes of biological data and samples.
The company’s strategy is coherent for that environment. It combines a broad product catalog with services that cover more of the customer workflow, from early research to manufacturing. That matters because pharmaceutical and biotech clients increasingly want fewer suppliers that can provide both critical tools and production support. Thermo Fisher has also used acquisitions to deepen capabilities in specialty areas and widen customer relationships.
Recent revenue trends suggest that the post-pandemic downturn has eased. After several quarters of contraction in 2023 and early 2024, growth turned positive again and accelerated into 2026, with year-over-year growth recently moving above the sector median. That does not erase the slower five-year growth profile, but it does indicate that the business has regained forward momentum after a difficult normalization period.
Cash generation remains one of the company’s strongest qualities. Free cash flow has stayed in the multi-billion-dollar range despite the earnings reset, which gives Thermo Fisher flexibility to fund acquisitions, invest in capacity, repurchase shares, and continue raising its dividend. The cash profile is especially relevant in a sector where many peers are either unprofitable or generate uneven returns.
A major catalyst is the continued buildout of biologics and advanced therapy manufacturing. Thermo Fisher’s bioproduction tools, consumables, and contract development and manufacturing capabilities place it in a favorable position as customers scale complex drugs from research into commercial production. Another important catalyst is the recovery in biotech funding and customer spending, which can lift demand for instruments, reagents, and outsourced services across the portfolio.
Recent company updates have also pointed to ongoing investment in high-growth categories such as electron microscopy, mass spectrometry, and genomics-related workflows. These are areas where customers often prioritize performance, compliance, and installed-base compatibility over price alone, which can support both expansion and healthy margins.
Risks
This article is for informational purposes only and does not constitute financial advice. Some content is AI-generated. See Disclaimer


