Stock Analysis · Telix Pharmaceuticals Limited (TLX)
Overview
Telix Pharmaceuticals Limited is a biotechnology company focused on radiopharmaceuticals, which are medicines that use radioactive isotopes for imaging or treatment. Its main activity is in cancer care, especially prostate cancer, kidney cancer, brain cancer, and blood-related cancers. The company develops products that help doctors find tumors more accurately with diagnostic scans and, over time, aims to expand further into targeted radiation therapies that treat disease directly.
Today, Telix is no longer just a development-stage biotech. It has become a commercial company with a meaningful revenue base, driven primarily by its approved prostate cancer imaging product portfolio. That matters for long-term analysis because it reduces dependence on future approvals alone and gives the company a funding source for research, commercialization, and pipeline expansion.
Based on recent company reporting, revenue is heavily concentrated in prostate cancer imaging, with additional contributions from licensing, manufacturing-related activities, and collaboration arrangements. The mix can shift by period, but the broad revenue picture appears to be as follows:
- Prostate cancer imaging products: approximately 85% to 95% of revenue. This mainly includes the company’s marketed PSMA-PET imaging franchise, used to detect and stage prostate cancer.
- Other commercial and collaboration revenue: approximately 5% to 15% of revenue. This can include licensing, service, milestone, and other partnership-related income depending on the reporting period.
- Therapeutic and non-core pipeline programs: currently a limited direct revenue contribution. These programs are strategically important but are not yet major revenue drivers.
This concentration shows both the strength and the current limitation of the business: Telix has a real commercial engine, but it is still largely powered by one core product area.
The company’s financial progression has been striking. Revenue expanded from a very small base in 2021 to a much larger commercial scale by 2025, while gross profit also rose sharply. At the same time, spending on research, development, and commercialization increased substantially, reflecting a business that is trying to turn one successful product platform into a broader oncology franchise.
The long-term pattern shows a company that has moved from early losses and minimal sales into sizable commercial revenue. Profitability improved meaningfully by 2024, but the 2025 profile also shows how rising operating costs and interest expense can weigh on earnings even when top-line growth remains strong.
Key Figures
| Metric | Value | Sector ⓘ |
|---|---|---|
| Date | Oct 10, 2026 | |
| Context | ||
| Sector | Healthcare | |
| Industry | Biotechnology | |
| Market Cap ⓘ | $3.74B | |
| Beta ⓘ | 0.56 | |
Value (Cheapness) | ||
| P/E Ratio ⓘ | 110.10 | 24.79 |
| P/B Ratio ⓘ | 5.58 | 2.97 |
| FCF Yield ⓘ | -2.02% | 3.11% |
| Dividend Yield ⓘ | N/A | 2.04% |
| EBIT / EV ⓘ | 1.61% | 0.57% |
| PEG ⓘ | N/A | |
Growth (Business expansion) | ||
| Revenue Growth ⓘ | 22.30% | 7.35% |
| RPS Growth (5Y CAGR) ⓘ | 239.30% | 8.61% |
| EPS Growth (5Y CAGR) ⓘ | N/A | -18.43% |
| BVPS Growth (5Y CAGR) ⓘ | 293.94% | 3.94% |
| Margin Growth (5Y Trend) ⓘ | 994.53% | -0.61% |
| FCF Growth (5Y CAGR) ⓘ | N/A | 0.88% |
| DPS Growth (5Y CAGR) ⓘ | N/A | 6.74% |
Quality (Business durability) | ||
| ROIC (Latest) ⓘ | N/A | 3.34% |
| ROA (Latest) ⓘ | 4.77% | 2.95% |
| ROIC (5Y Median) ⓘ | N/A | 4.60% |
| ROA (5Y Median) ⓘ | -0.65% | 1.89% |
| Net Debt / EBIT (Latest) ⓘ | 6.98 | 1.36 |
| Net Debt / EBIT (5Y Median) ⓘ | -1.39 | 1.86 |
| Net Debt / EBITDA (Latest) ⓘ | 3.30 | 1.02 |
| Net Debt / Assets ⓘ | 24.08% | 5.85% |
| EBITDA / Interest ⓘ | 3.66 | 9.60 |
| Operating Margin (Latest) ⓘ | 2.71% | 9.19% |
| Operating Margin (5Y Median) ⓘ | 3.23% | 7.53% |
| Debt to Equity (Latest) ⓘ | 118.90% | 29.44% |
| Profit Margin (Latest) ⓘ | 3.76% | 3.52% |
| Free Cash Flow (Latest) ⓘ | -$75.55M | |
Momentum (Price trend) | ||
| 3Y Return ⓘ | N/A | +34.80% |
| 12M Return (excl. last month) ⓘ | +32.38% | +19.33% |
| 6M Return ⓘ | +12.58% | +7.18% |
| Price vs. 200-Day MA ⓘ | +13.36% | +3.20% |
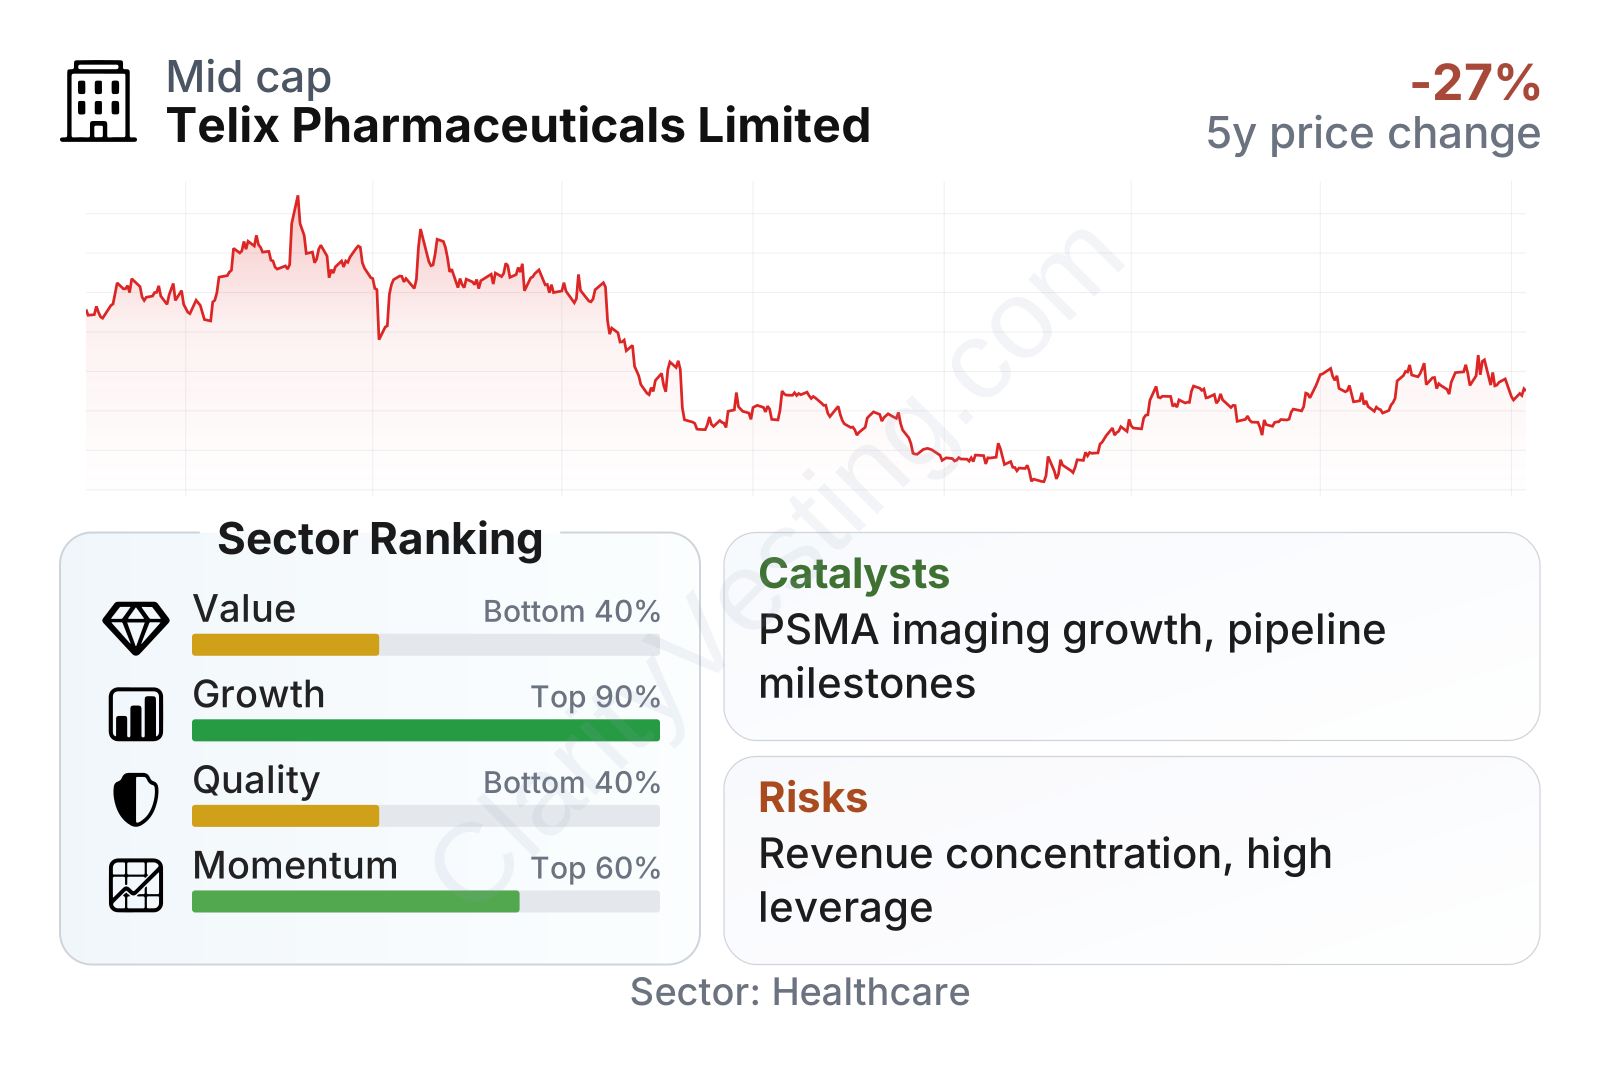
Telix stands out much more on growth than on traditional value or balance-sheet quality. Revenue growth is well above the sector median, and the longer-term expansion in revenue per share and book value per share is exceptionally strong. Momentum has also been relatively favorable, with the stock recovering from its lows and trading above its longer-term trend. By contrast, valuation multiples remain elevated, free cash flow is still negative, and leverage is clearly higher than typical healthcare peers.
In size terms, Telix sits in the mid-cap range rather than among the largest global pharmaceutical groups. Its share-price path over the past year reflects both that growth appeal and the market’s sensitivity to execution, regulatory events, and funding concerns.
Growth
Telix operates in a part of healthcare that has attracted growing attention: precision oncology and radiopharmaceuticals. This area benefits from several supportive forces at once. Cancer diagnosis is moving toward more targeted imaging, physicians increasingly want better tools to locate disease before treatment decisions, and large pharmaceutical companies have shown greater interest in targeted radiotherapy platforms. That creates a favorable industry backdrop.
The company’s strategy also has a logical structure. It started with diagnostic imaging, where clinical adoption can be faster and commercial infrastructure can be built earlier, then used that platform to expand into therapeutic candidates and adjacent tumor types. In practical terms, that means Telix is trying to use one successful commercial beachhead to support broader pipeline development rather than relying only on external funding.
A key growth driver is the continued expansion of prostate cancer imaging demand. If physicians keep adopting PSMA-based imaging as part of routine care, Telix may continue to benefit from higher scan volumes, wider geographic reach, and stronger operational scale. Beyond that, the larger opportunity is whether the company can replicate its prostate imaging success in other cancers and eventually in therapeutic radiopharmaceuticals, where commercial potential can be significantly larger but also more complex.
Recent company updates have also kept attention on pipeline progress, manufacturing capacity, and regulatory milestones. For a company like Telix, the most important opportunities usually come from three areas: new product approvals, label expansions for existing products, and successful advancement of therapeutic candidates into later-stage development. Any progress on those fronts would be more significant than short-term fluctuations in quarterly earnings.
Another encouraging sign is that Telix has already shown it can convert scientific development into commercial sales. Many biotech companies remain pre-revenue for years; Telix has crossed that hurdle. That does not remove risk, but it does make the growth case more tangible because future expansion starts from an established customer base rather than from zero.
Risks
This article is for informational purposes only and does not constitute financial advice. Some content is AI-generated. See Disclaimer


